
- In the app sidebar, open
Reportingto access: Generalfor security and developer insightsScansfor scan operations and PR policy statusAgingfor vulnerability aging and overdue trend analysis (available when policies are enabled)
Code Vulnerabilitiesshows unique vulnerability counts, category coverage, false positives, remediation progress, MTTR, and burn-down trends.
Code Vulnerabilities, Fixed Issues Over Time tracks unique findings by their first fix date, and Open Findings by Classification breaks down open findings by classification and severity. Reporting counts each finding once across repeated scans, using its latest detection in the selected scope. Use the status checkboxes in Vulnerability Status Flow to show or hide statuses; false positives are hidden by default.
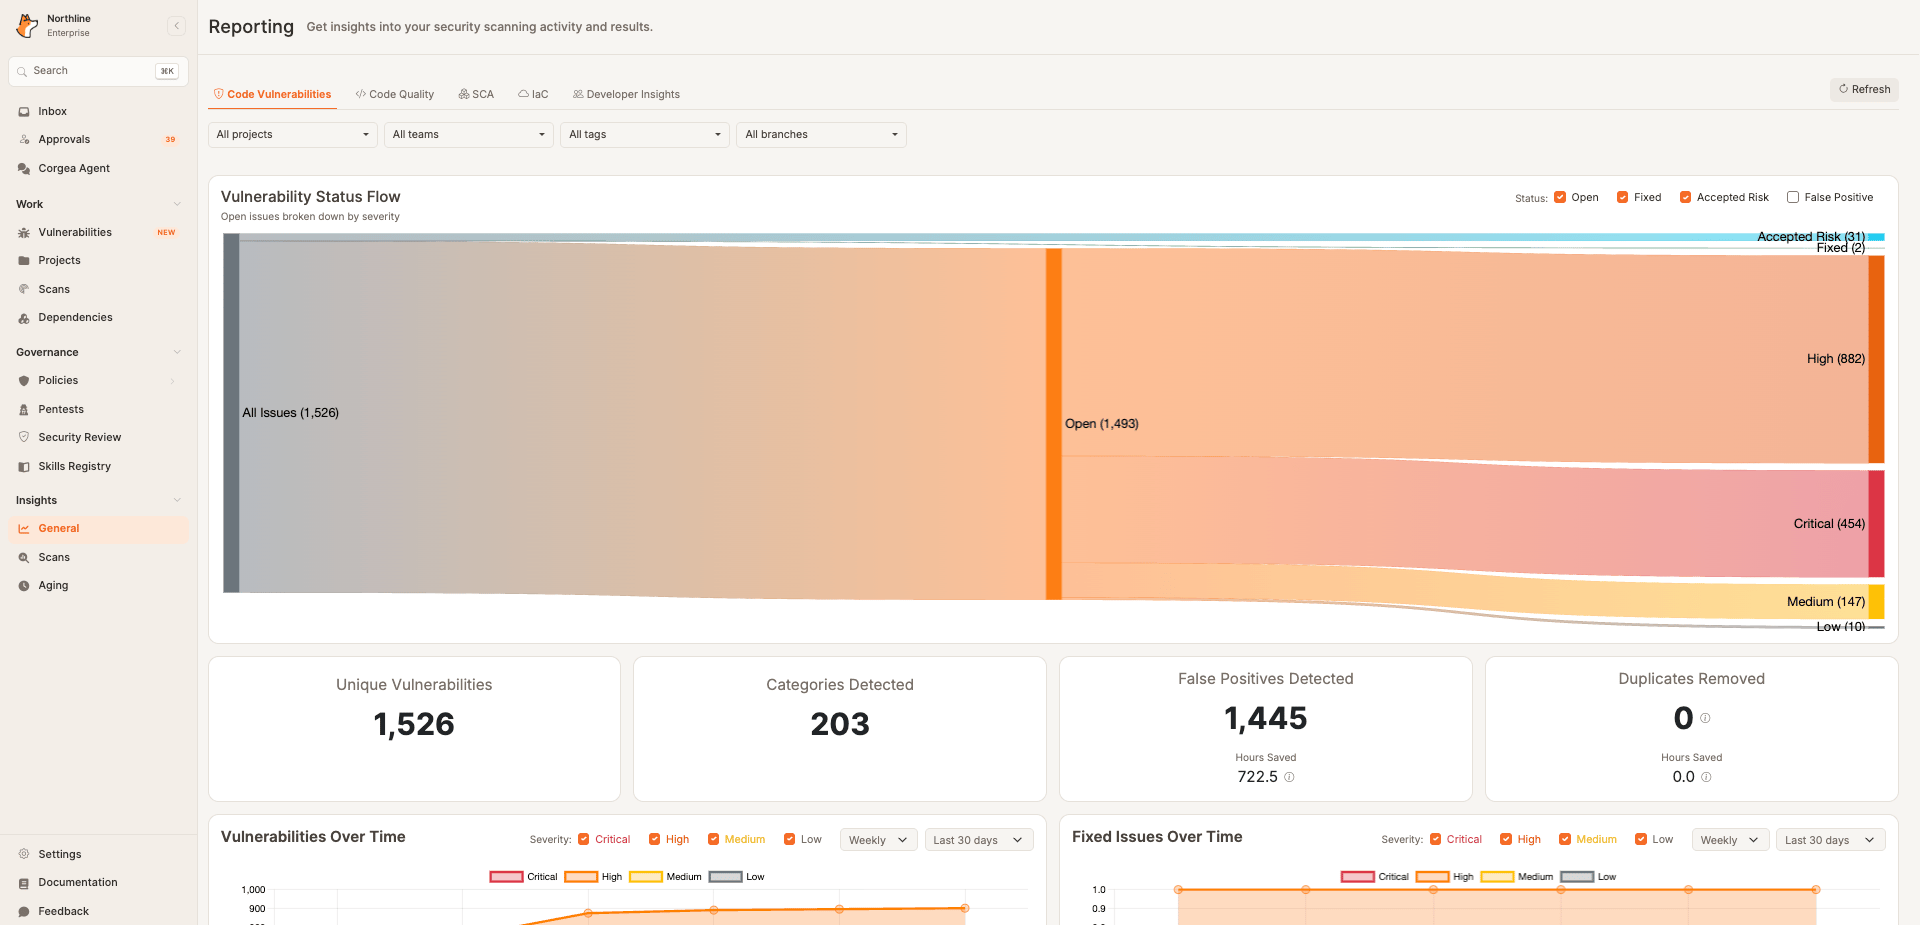
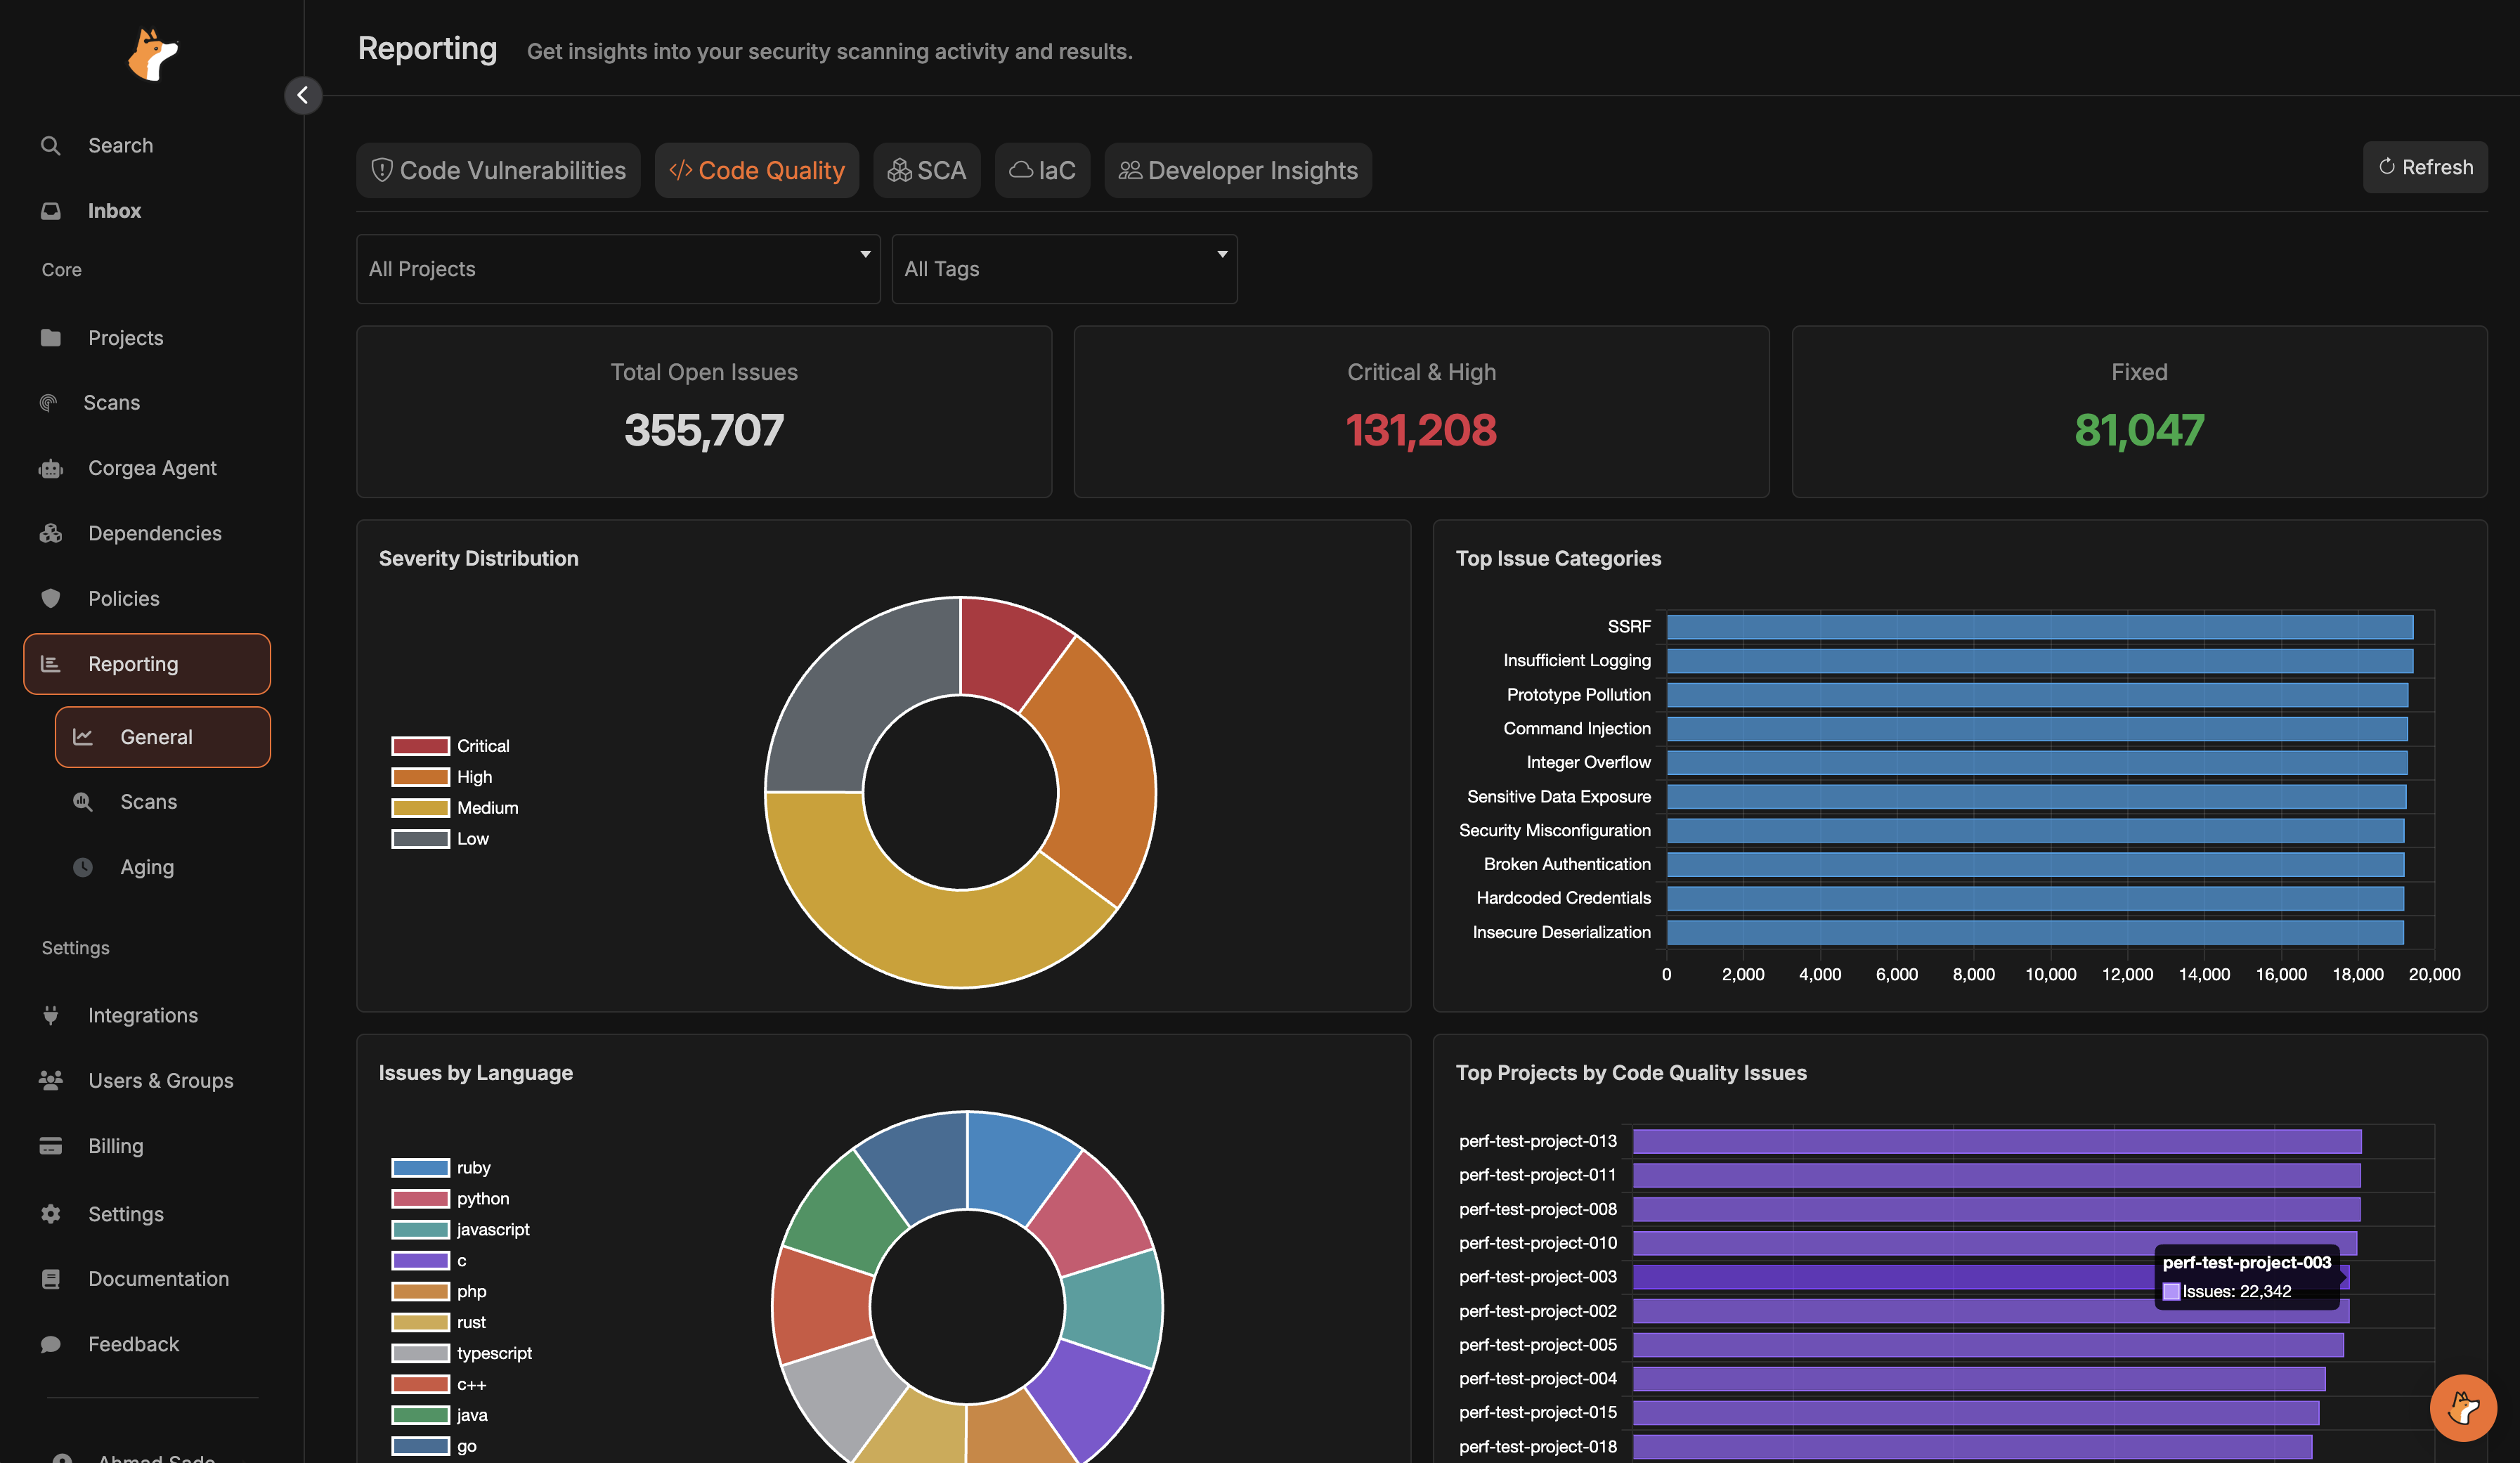
Code Qualityhighlights open vs fixed issues, severity distribution, categories, languages, and top projects.
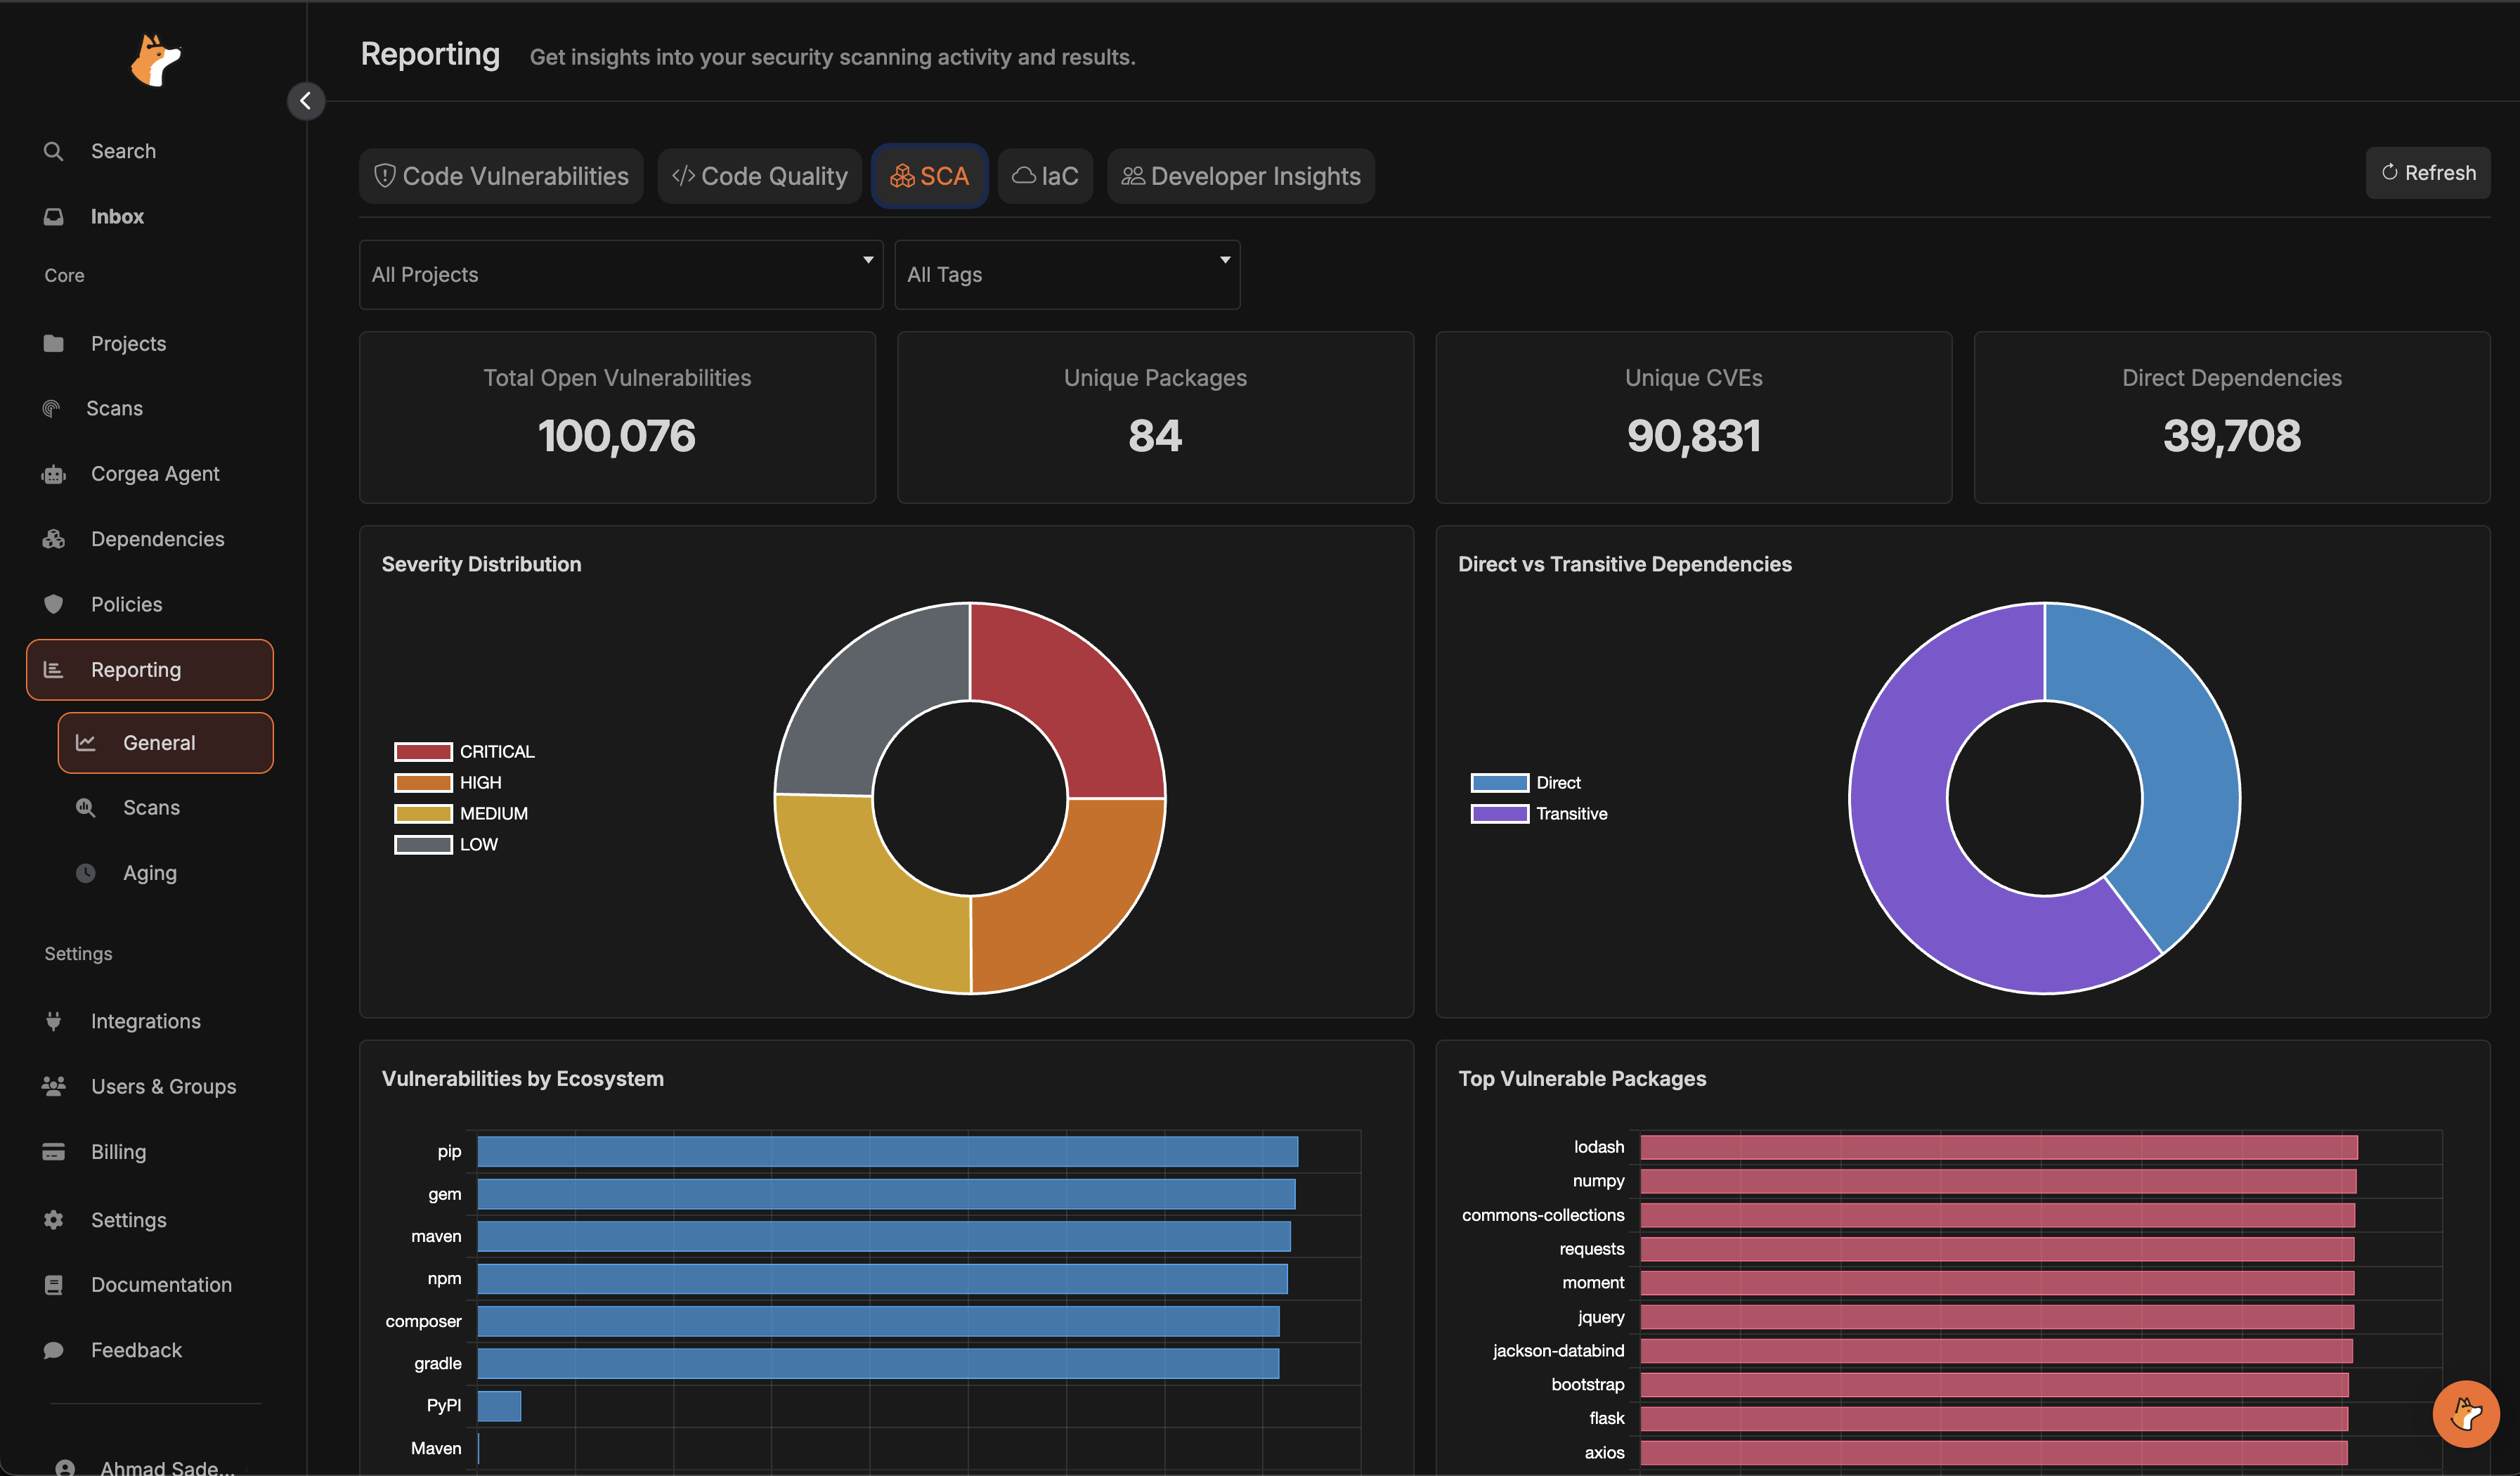
SCAsummarizes dependency vulnerabilities by severity, ecosystem, package, and direct vs transitive impact.
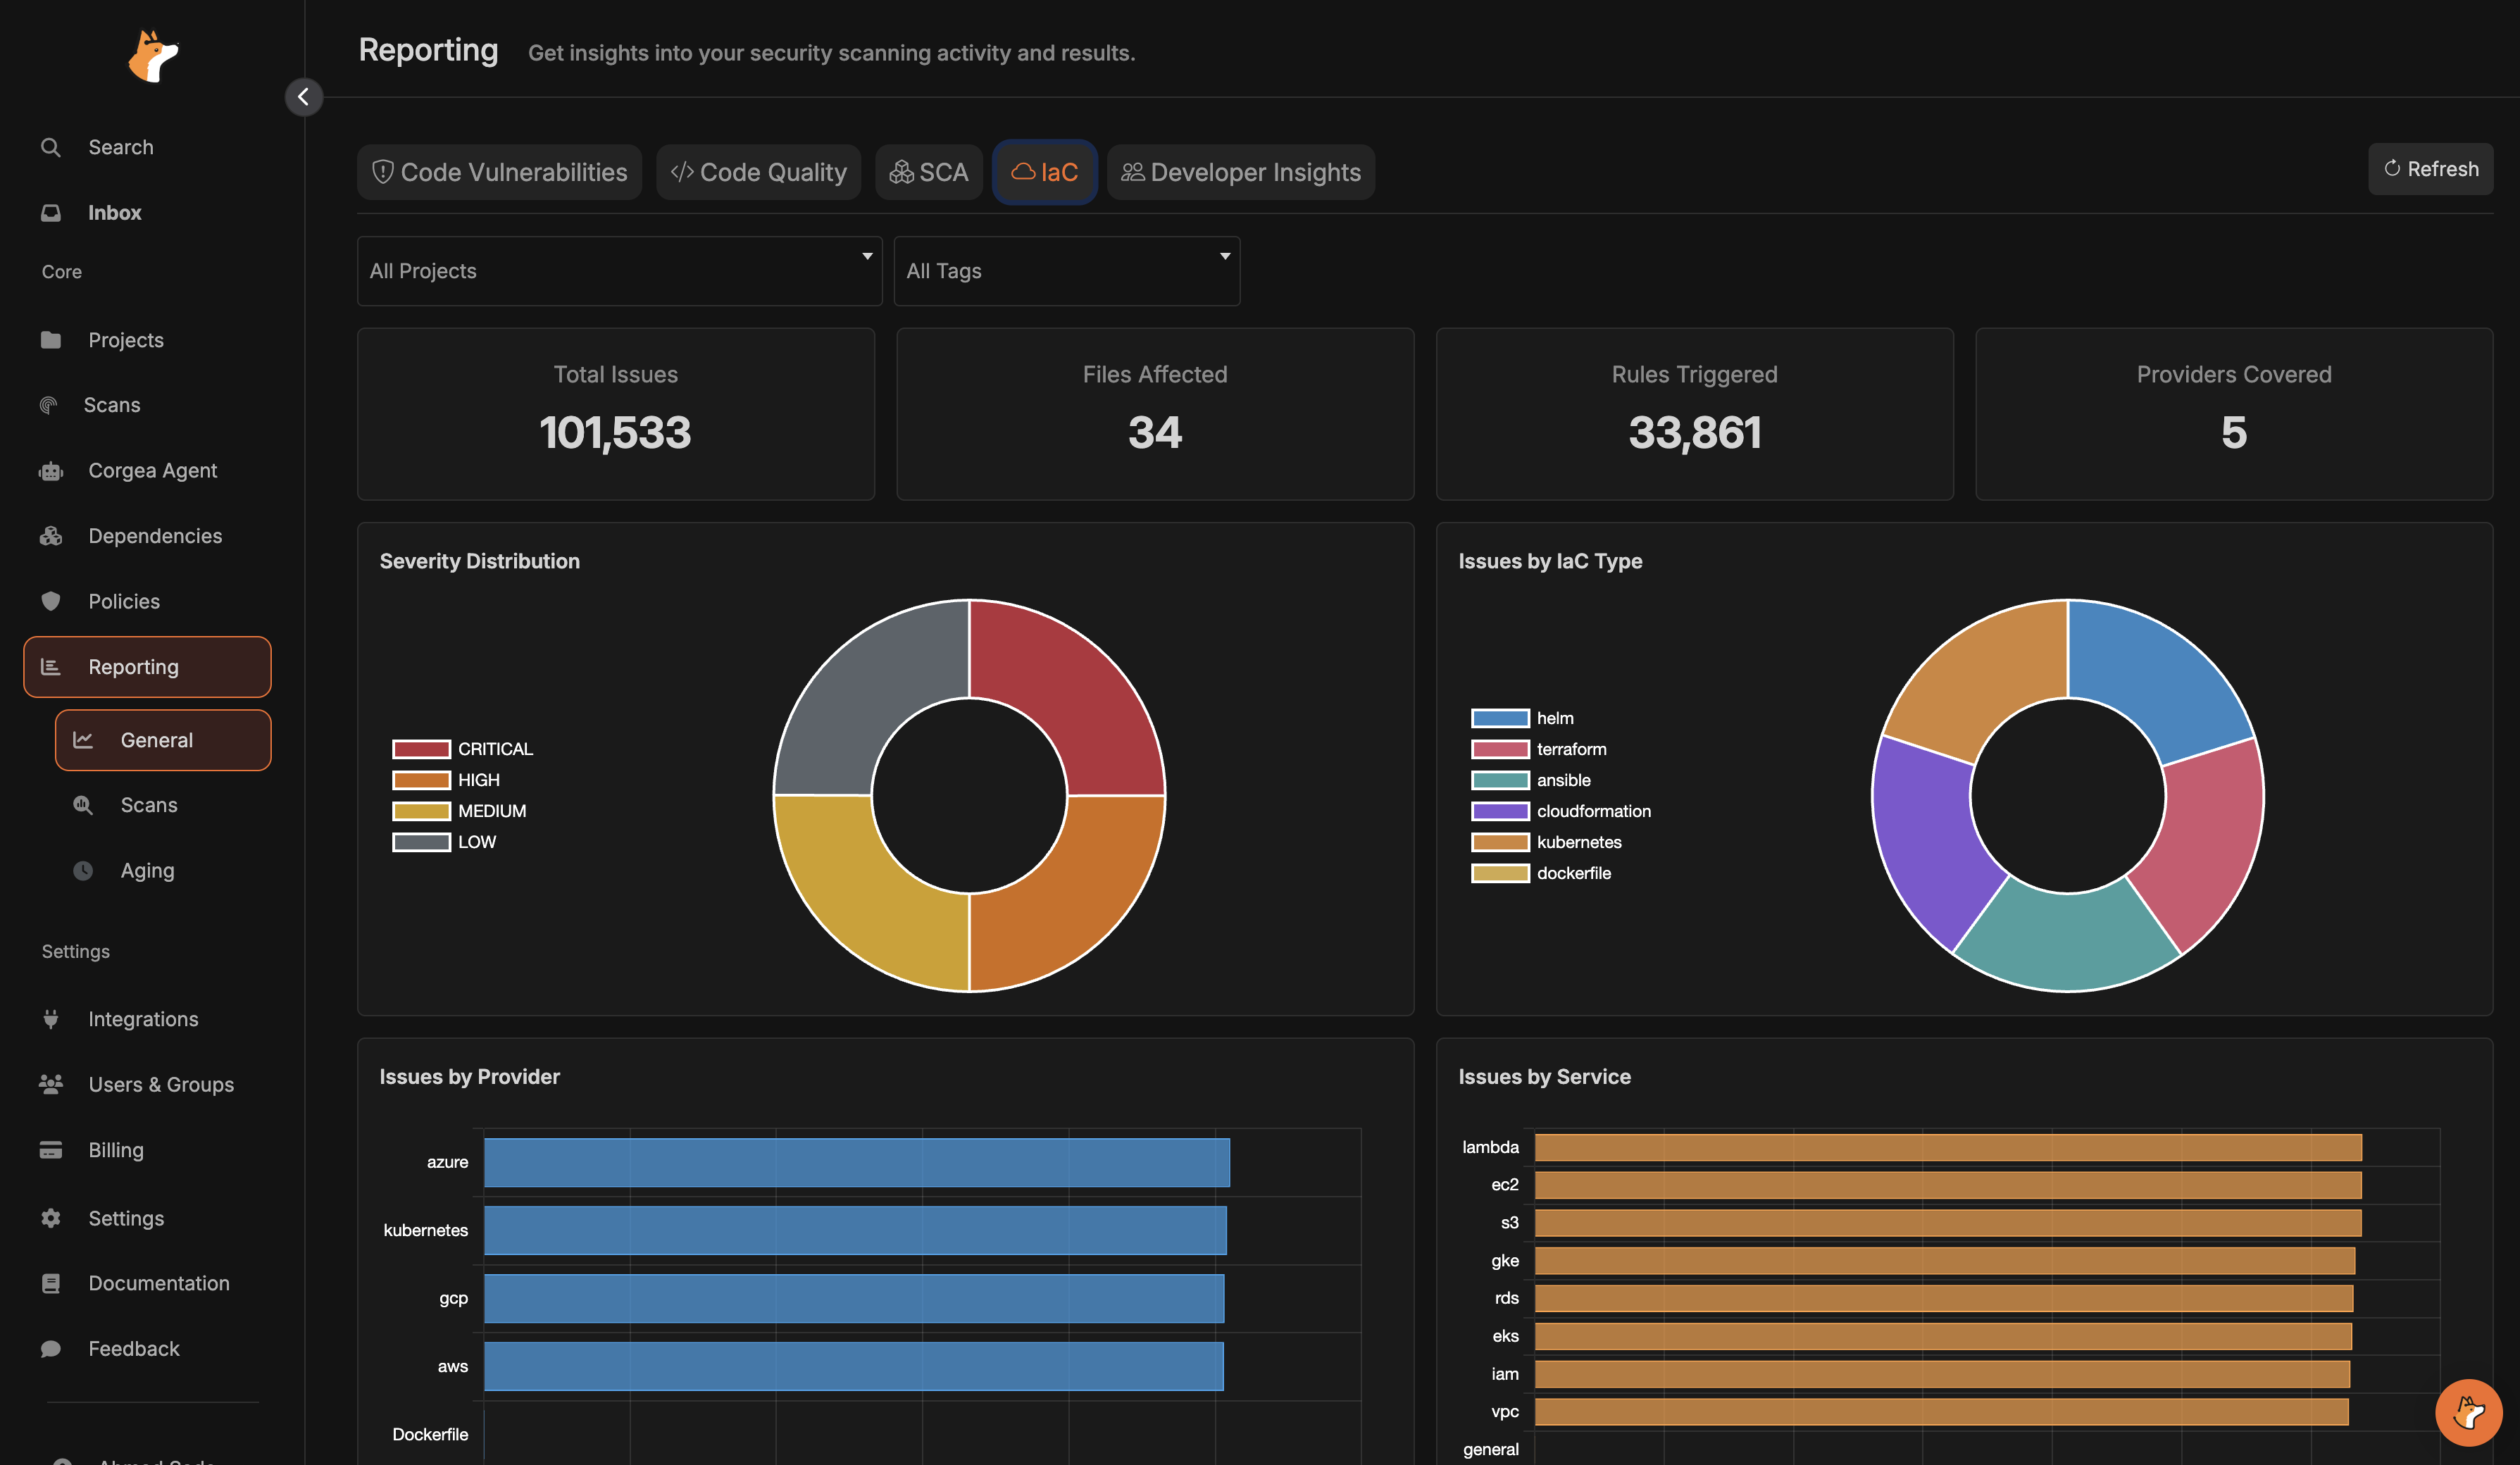
IaCbreaks down infrastructure findings by severity, provider, service, rule, and IaC type.
Developer Insightscombines developer feedback and Corgea Agent usage trends, decisions, and active users.
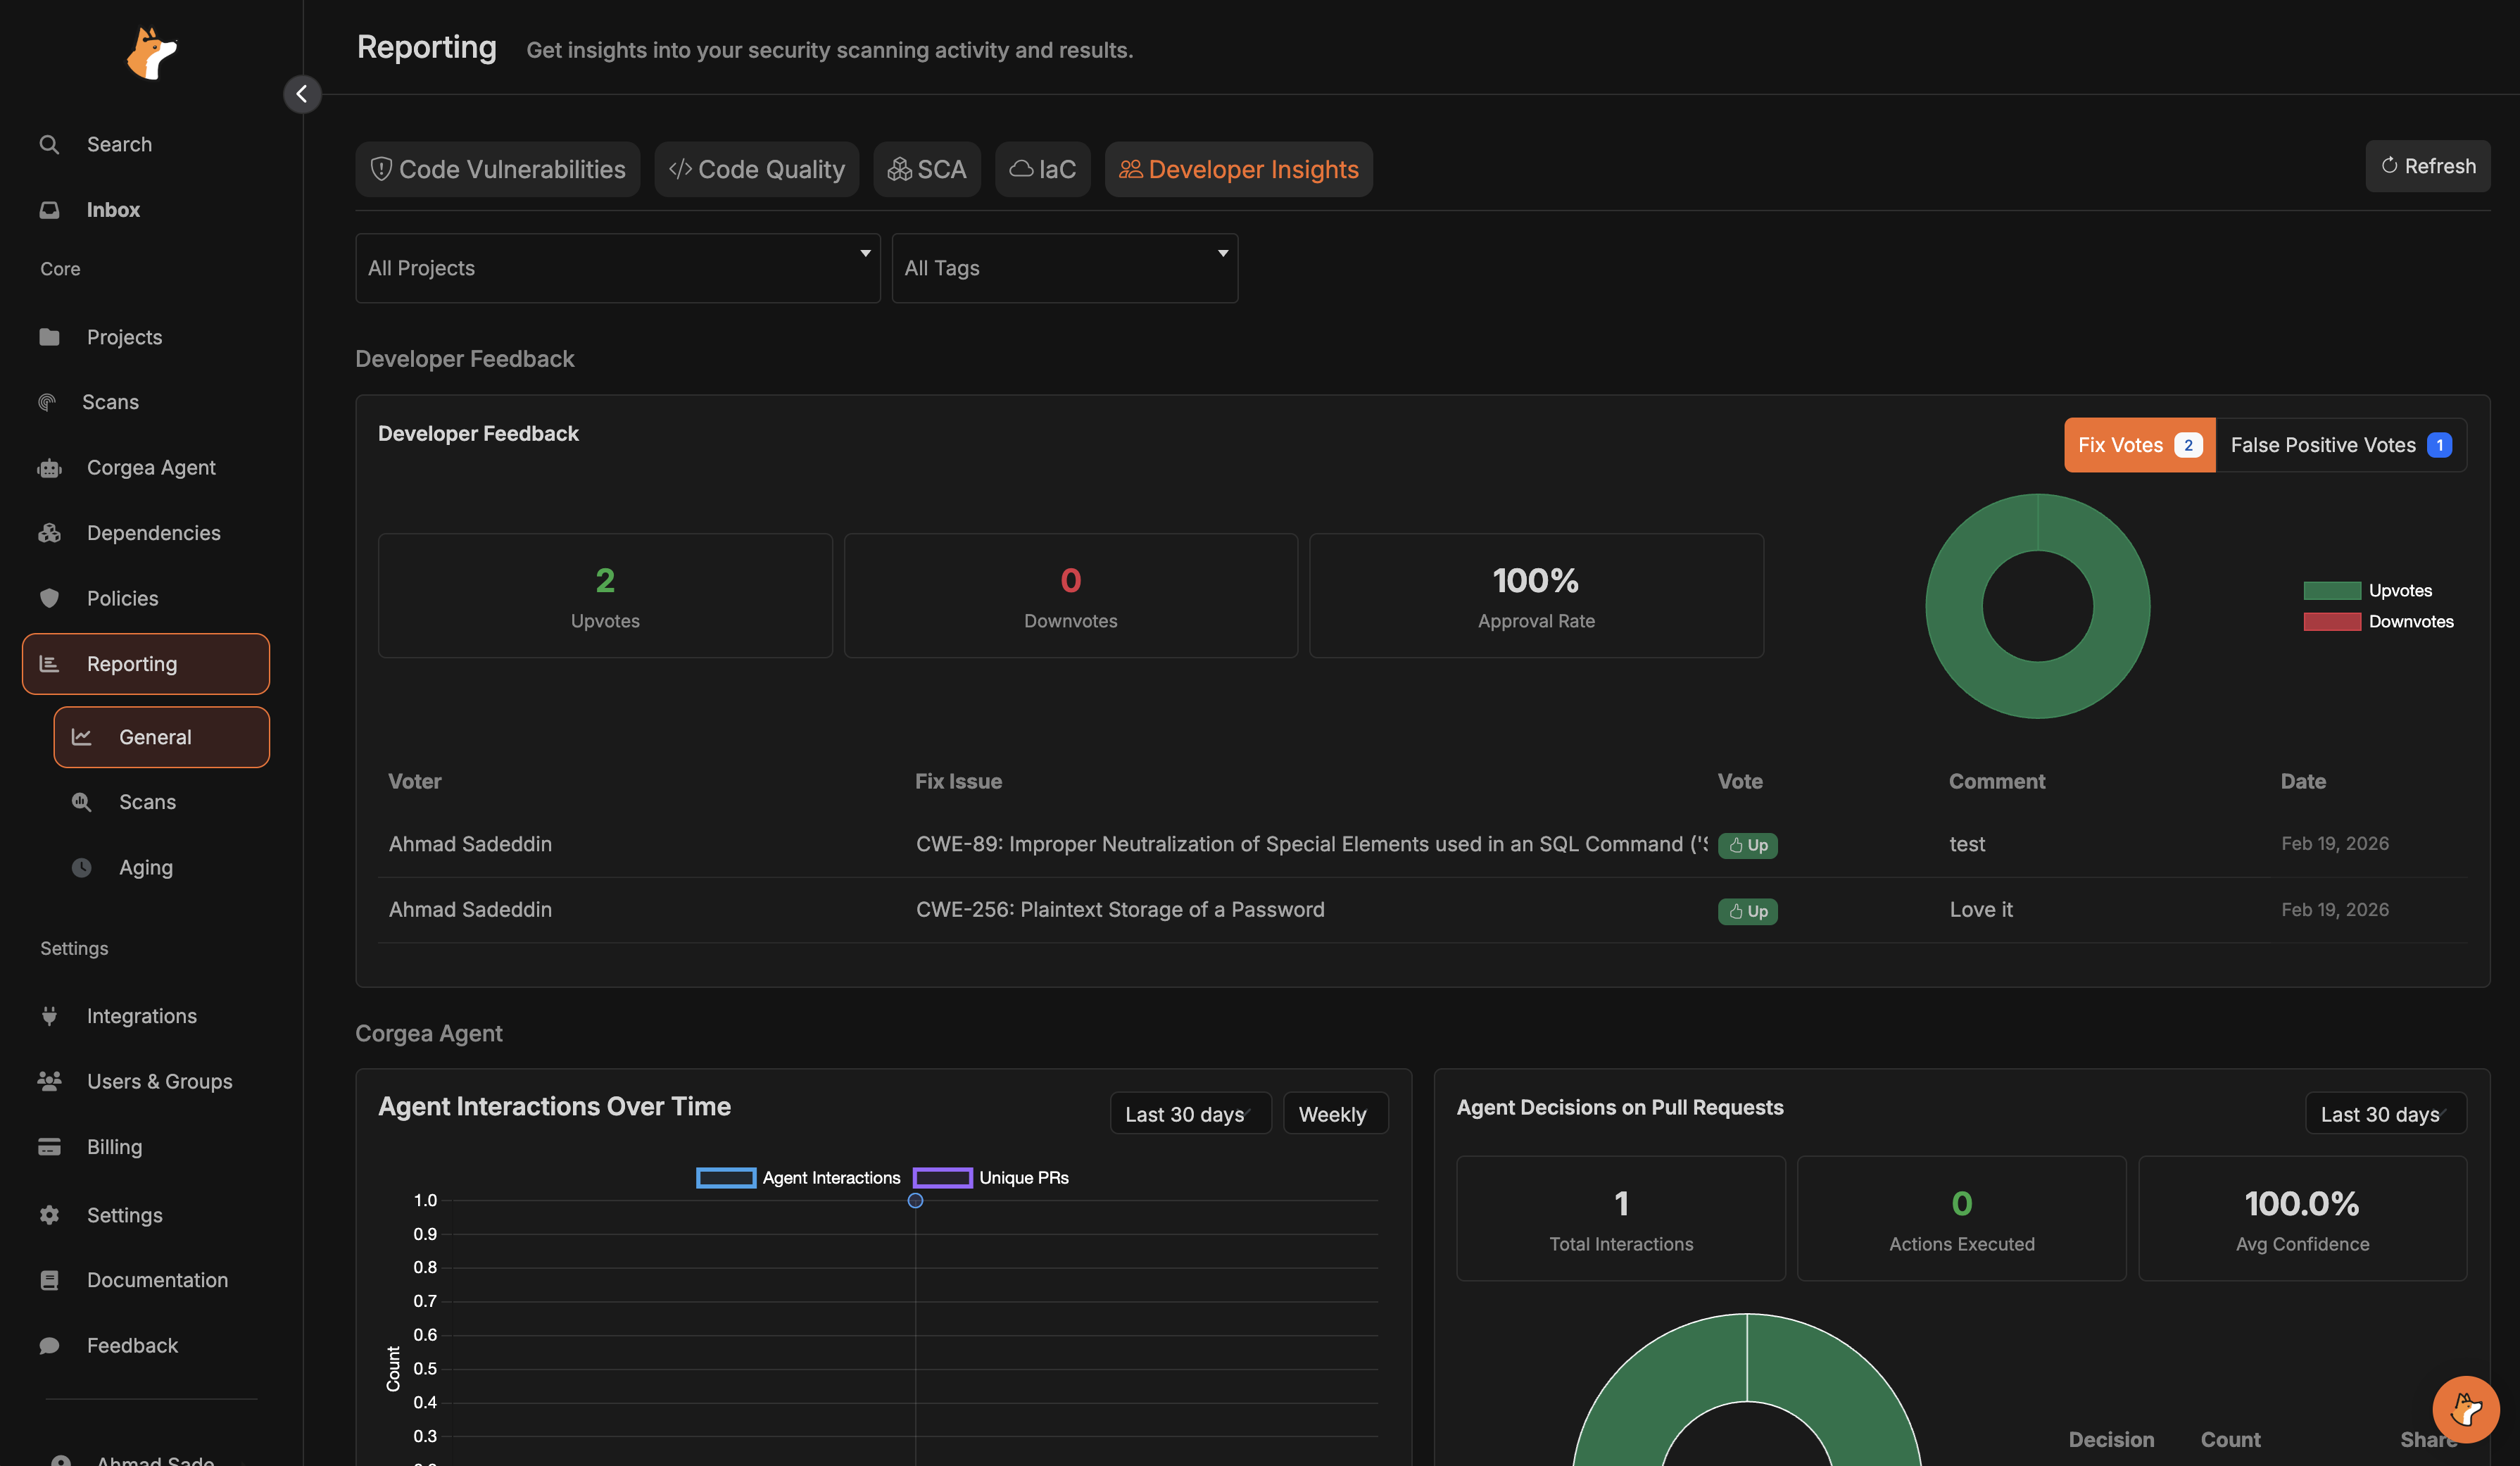
- In
General, use the searchable project, team, tag, and branch dropdowns to select multiple values. ClickApplyin each dropdown to update the charts, orClearto reset all filters. Select projects first to choose their scanned branches. - Values within one filter match any selected value; different filters apply together. Results include only projects you can access. Team membership includes directly linked projects and projects matching the team’s tags or repository URL patterns.
- For time-series charts, choose a date range and group by day, week, or month.
- Severity filters on supported charts let you focus on critical, high, medium, or low issues.
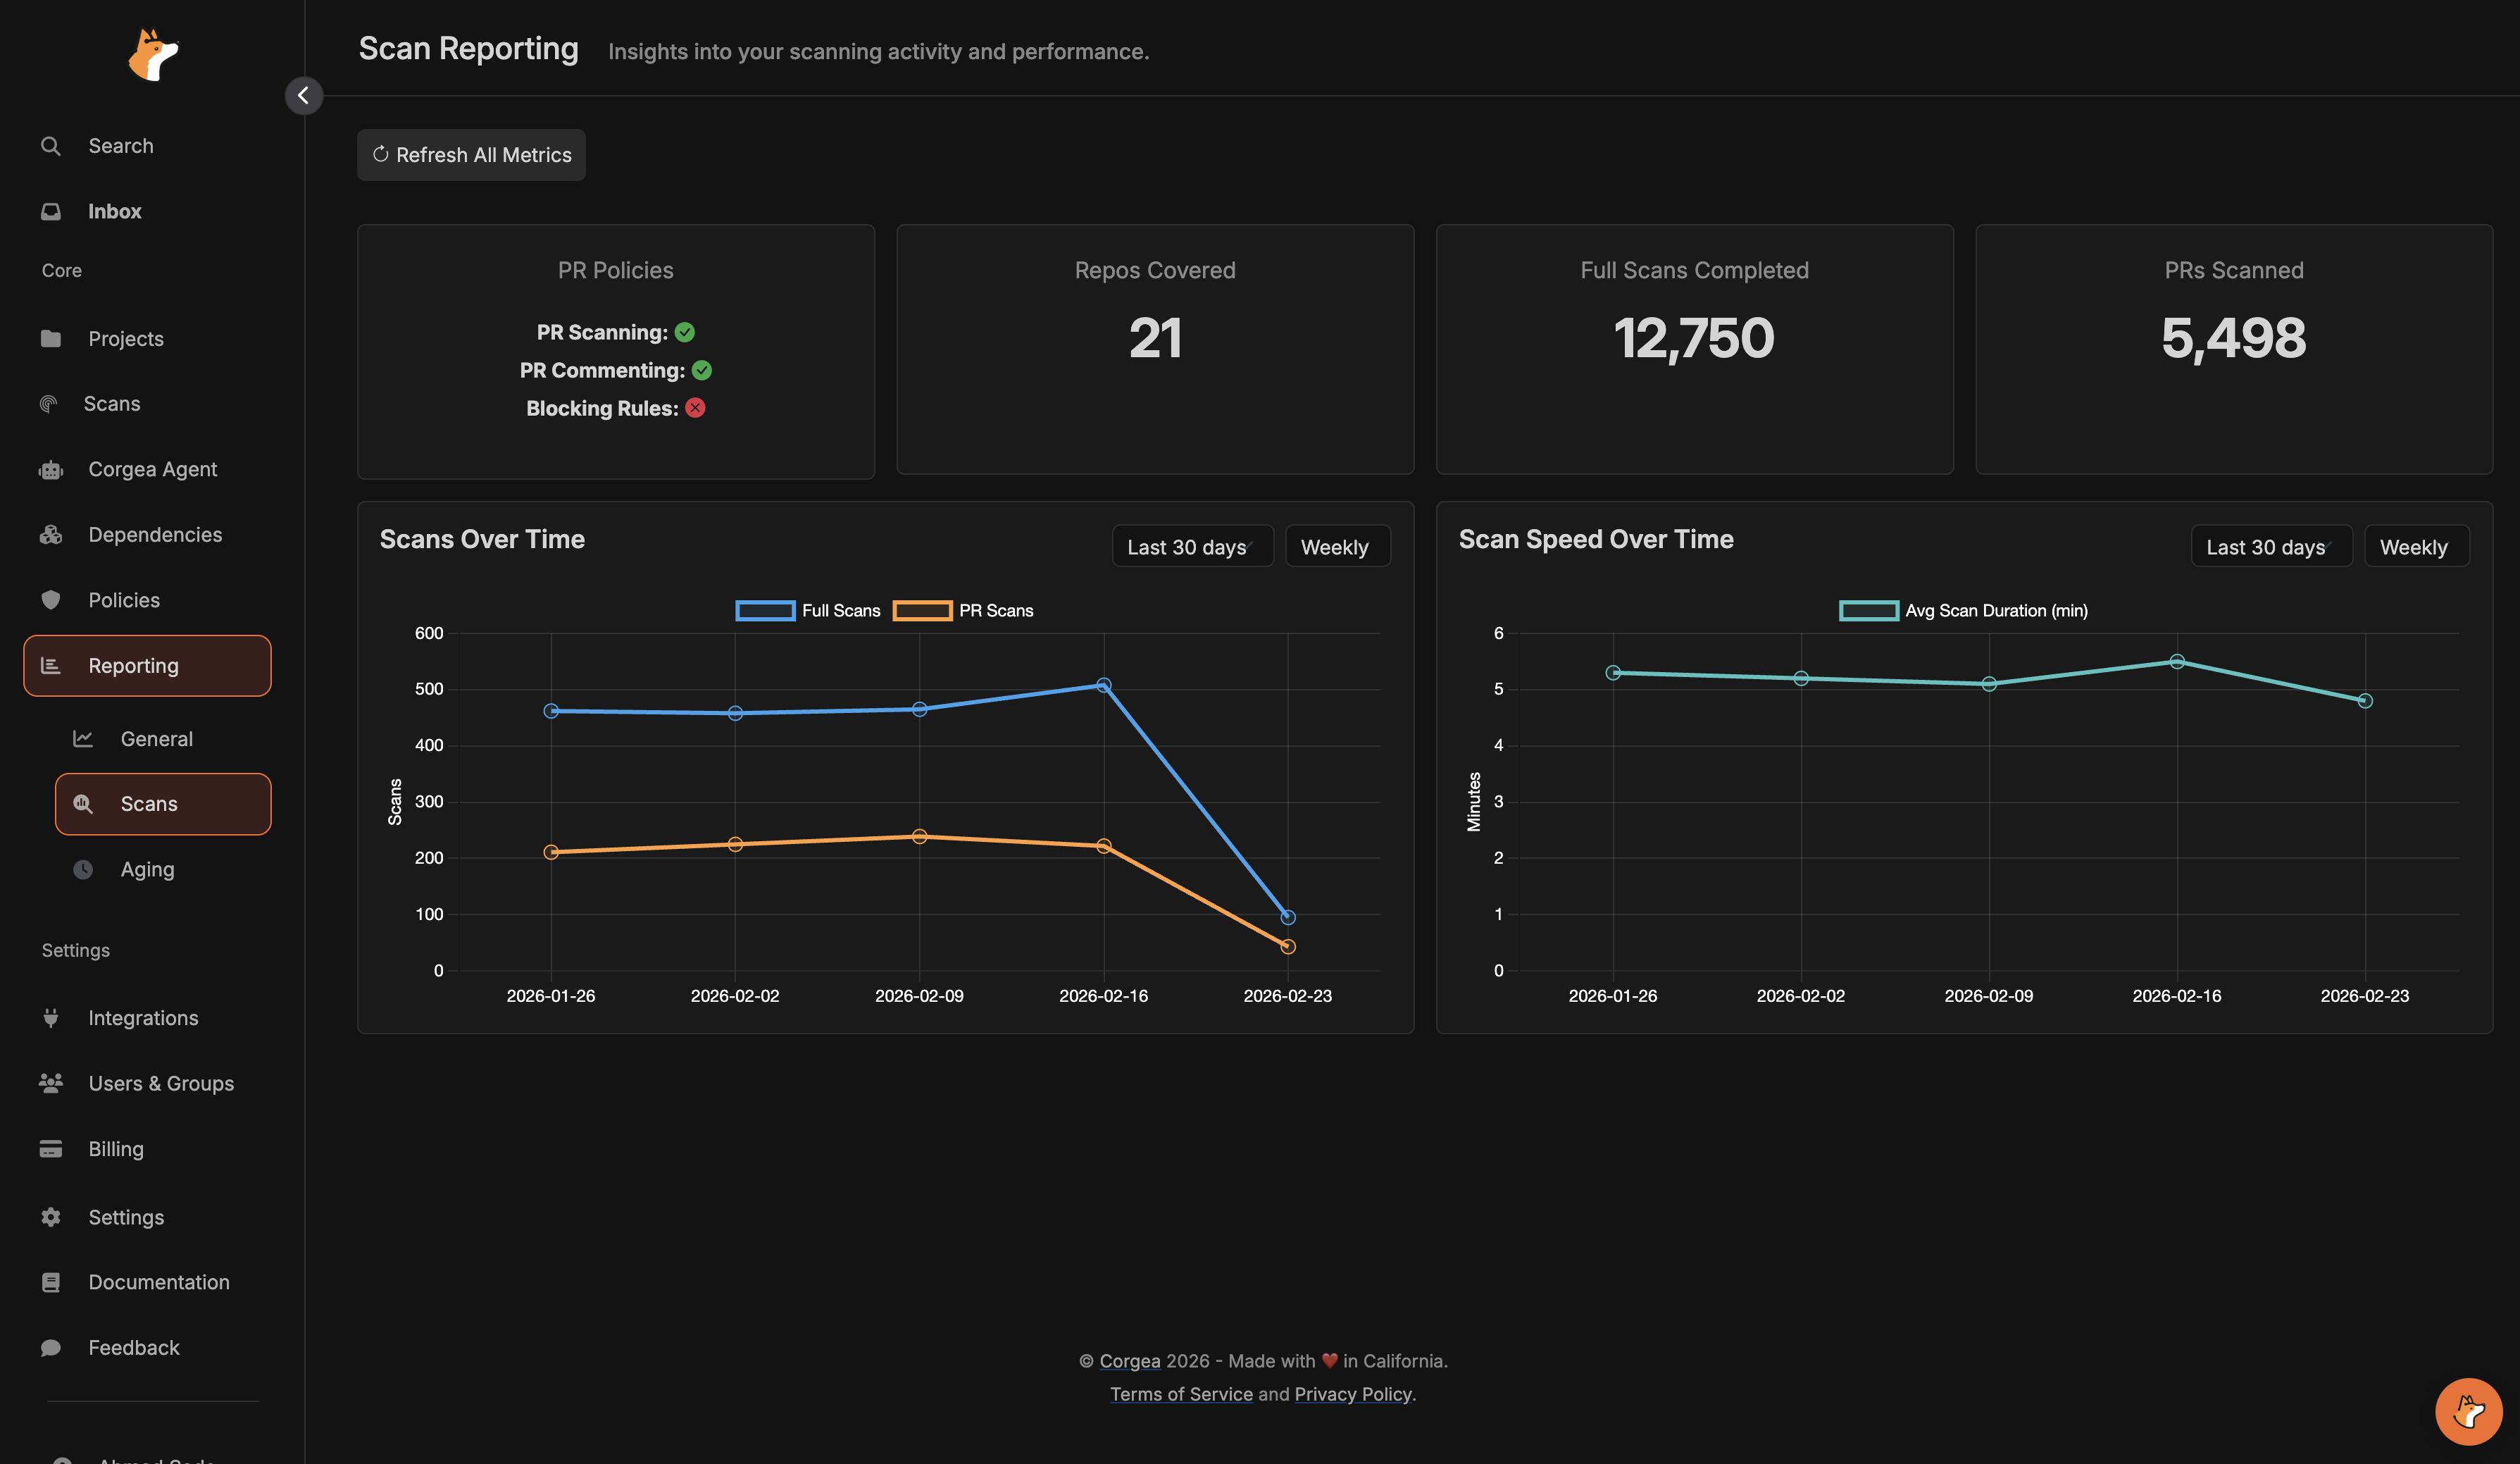
Scansfocuses on operational visibility, including PR policy status, repositories covered, full scans, PR scans, and scan performance over time.
- The aging report highlights overdue code and dependency issues, average age, and where risk is accumulating by project and assignee.
- Assign issues from the issue details pages so overdue breakdowns and SLA emails reach the right owner.
- Configure SLAs in SLA Management.