> ## Documentation Index
> Fetch the complete documentation index at: https://docs.corgea.app/llms.txt
> Use this file to discover all available pages before exploring further.
# Webhooks
> Automate HTTP callbacks from Corgea to any external system
## What are Webhooks?
Webhooks are automated HTTP callbacks that allow Corgea to send real-time notifications to your external systems when specific events occur. Instead of continuously polling our API to check for updates, webhooks push event data directly to your specified endpoint the moment something happens.
### Key Benefits
* **Real-time notifications** - Receive instant updates when security issues are found, status changes occur, or scans complete
* **Automation** - Trigger workflows in external tools like Slack, Zapier, or custom applications
* **Efficiency** - No need to poll APIs - we push data to you when events happen
* **Flexibility** - Subscribe only to the events you care about and filter by project, status, or scheduled scan
* **Reliability** - Built-in retry logic and delivery tracking ensure your notifications get through
### Supported Event Types
Corgea supports webhooks for the following events:
**Issue Events:**
* `issue.status_changed` - Triggered when an issue's status is updated (e.g., open → fixed)
* `issue.assigned` - Triggered when an issue is assigned to a team member
**SLA Events:**
* `sla.violation` - Triggered when the daily SLA job finds one or more SAST or SCA issues past their remediation or escalation deadline (configured per SLA in [SLA Management](sla_management))
**Scan Events:**
* `scan.started` - Triggered when a security scan begins
* `scan.completed` - Triggered when a scan finishes successfully
* `scan.failed` - Triggered when a scan encounters an error
* `scheduled_scan.daily_report` - Triggered daily when scheduled scan runs complete, summarizing new issues found across all runs in the last 24 hours. See [Notifications](notifications#daily-scheduled-scan-report) for the email and payload schema.
Scan lifecycle events (`scan.started`, `scan.completed`, `scan.failed`) include `data.message` — a short plain-text summary you can drop into Slack, Zapier, or other chat tools. They also include triage fields: `pull_request_id`, `scan_url`, `true_positive_count`, `project_name`, and `status`.
For Slack Workflow Builder (`Type = Slack` + `hooks.slack.com/triggers/...`), Corgea flattens **only** `scan.started` / `scan.completed` / `scan.failed` and `webhook.test` into top-level keys. Do not map nested `data.*` in Slack — that causes HTTP 400. Other event types on the same Slack webhook keep the nested envelope. See [Slack](slack).
**User Auth Events:**
* `user.login` - Triggered when a user successfully logs in
* `user.login_failed` - Triggered when a user login attempt fails
***
## How Webhooks Work
### The Webhook Lifecycle
Something happens in Corgea (e.g., a scan completes, an issue status changes)
The system identifies all webhooks subscribed to that event type
Project, status, scheduled scan, PR-only, and completed-with-findings filters determine if the webhook should fire
By default, a standardized JSON envelope is constructed with event details (or your custom body template is used, if configured). For Slack Workflow Builder (`Type = Slack` + `triggers/` URL), Corgea flattens the HTTP body for `scan.*` and `webhook.test` only; other events stay nested.
The payload is sent to your webhook URL with security headers
If the request fails, automatic retries occur with exponential backoff
All attempts are tracked in the delivery history for troubleshooting
### Payload Structure
By default, webhook payloads follow a standardized nested envelope (Zapier / Other). Scan lifecycle events include `data.message` plus triage fields:
```json webhook-payload.json theme={null}
{
"event_id": "550e8400-e29b-41d4-a716-446655440000",
"event_type": "scan.completed",
"timestamp": "2025-01-15T14:30:00.000Z",
"data": {
"company": "company-uuid",
"scan_id": "scan-uuid",
"run_id": "run-12345",
"project": {
"id": "project-uuid",
"name": "My Application"
},
"project_name": "My Application",
"branch": "feature/auth",
"engine": "corgea-blast",
"scan_type": "full",
"status": "completed",
"pull_request_id": "42",
"scan_url": "https://app.corgea.app/project/project-uuid/?scan_id=scan-uuid",
"true_positive_count": 5,
"summary": {
"total_issues": 12,
"issues_with_fixes": 7,
"issues_without_fixes": 5,
"true_positive_count": 5,
"true_positive_issues_with_fixes": 3
},
"message": "Scan completed for My Application (PR #42): 5 true-positive findings (3 with fixes). View: https://app.corgea.app/project/project-uuid/?scan_id=scan-uuid",
"scheduled_scan_ids": ["scheduled-scan-uuid"],
"processed_at": "2025-01-15T14:30:00.000Z",
"created_at": "2025-01-15T14:00:00.000Z"
}
}
```
`summary.total_issues` counts all non-deleted issues (including false positives and code-quality). `true_positive_count` is the triage count used in `message` and Scan Event Filters.
| Event | Example `data.message` |
| ---------------- | --------------------------------------------------------------------------------- |
| `scan.started` | `Scan started for My Application (PR #42).` |
| `scan.completed` | `Scan completed for My Application (PR #42): 5 true-positive findings. View: ...` |
| `scan.failed` | `Scan failed for My Application (PR #42): Scanner timed out. View: ...` |
`true_positive_count` counts non-deleted security findings that are not false positives (same logic as the scan UI: excludes `status=false_positive`, `hold_reason=false_positive`, and `detected_by=code-quality`). The optional `(N with fixes)` suffix in `scan.completed` messages counts fixes only among those true-positive findings (not all issues on the scan).
**Slack Workflow Builder:** when `Type = Slack` and the URL is `hooks.slack.com/triggers/...`, Corgea POSTs a **flat** body for `scan.*` and `webhook.test` (top-level `message`, `pull_request_id`, `scan_url`, `true_positive_count`, `company`, etc.). Nested `data.*` mapping is unsupported in Slack and causes HTTP 400. Non-scan events on that webhook are **not** flattened. See [Slack](slack).
**Example `sla.violation` payload** (from SLA Management daily job):
```json sla-violation-payload.json theme={null}
{
"event_id": "550e8400-e29b-41d4-a716-446655440001",
"event_type": "sla.violation",
"timestamp": "2025-01-15T14:30:00.000Z",
"data": {
"company": "1",
"sla": {
"id": 3,
"rule_type": "code",
"urgency": ["CR", "HI"],
"remediation_days": 7,
"escalation_days": 3
},
"notification_type": "remediation",
"issue_kind": "SAST",
"issue_count": 5,
"summary_message": "Plain-text summary (same style as email body)...",
"projects": [
{
"id": "project-uuid",
"name": "My Application",
"url": "https://app.corgea.com/project/project-uuid",
"issue_count": 5,
"urgency_counts": {
"Critical": 2,
"High": 3
}
}
]
}
}
```
| Field | Description |
| ------------------- | -------------------------------------------------------------------- |
| `notification_type` | `remediation` or `escalation` |
| `issue_kind` | `SAST` or `SCA` |
| `sla.rule_type` | `code` (SAST) or `sca` (dependency) |
| `projects` | One entry per affected project; used for webhook **project filters** |
Subscribe to `sla.violation` under **Integrations → Webhooks**, or attach a webhook from the [SLA Management](sla_management) form (existing webhooks are auto-subscribed).
**Example `scheduled_scan.daily_report` payload**:
```json scheduled-scan-daily-report-payload.json theme={null}
{
"event_id": "550e8400-e29b-41d4-a716-446655440002",
"event_type": "scheduled_scan.daily_report",
"timestamp": "2025-01-15T14:30:00.000Z",
"data": {
"title": "Corgea Daily Scan Report",
"company": "1",
"company_name": "Acme Security",
"total_new_issues": 7,
"message": "Daily scan report for Acme Security: 7 new issues detected across 2 scan runs.",
"scan_runs": [
{
"scheduled_scan_name": "Weekly Production Scan",
"project": "Payments API",
"new_issue_count": 4,
"scan_url": "https://www.corgea.app/scans/scan-uuid"
}
]
}
}
```
This event is sent to every webhook subscribed to it. There is no separate on/off switch for webhook delivery, and notification email preferences do not affect it.
If you configure **Custom Body** during webhook setup, Corgea sends your rendered JSON object instead of the default payload structure.
The `scheduled_scan.daily_report` event uses the same envelope but has its own `data` schema. See [Payload Examples](#payload-examples) for the full reference.
### Security Features
* Corgea automatically generates a secret key when you create a webhook
* Each request includes an `X-Corgea-Signature` header with an HMAC-SHA256 hash of the payload
* Verify the signature with your secret key to ensure the webhook came from Corgea
* Include headers required by your endpoint (e.g., authentication tokens)
* Configure custom headers during webhook setup
* All webhook URLs must use HTTPS (ports 443 or 80 only)
* URLs must not embed credentials in the URL
* Destinations that resolve to private, loopback, link-local, reserved, or multicast addresses are rejected (SSRF protection)
* Operators can optionally restrict hosts with the `WEBHOOK_ALLOWED_HOSTS` setting
### Automatic Retry Logic
If webhook delivery fails, Corgea automatically retries with the following strategy:
* **Initial attempt** + **2 retries** = 3 total attempts
* **Exponential backoff**: 2 seconds, 4 seconds between retries
* **Timeout**: 10 seconds per request
* **Auto-pause**: After 10 consecutive failures, the webhook is automatically paused
### Headers Sent with Each Webhook
```text webhook-headers.txt theme={null}
Content-Type: application/json
X-Corgea-Event: issue.status_changed
X-Corgea-Delivery:
X-Corgea-Timestamp:
X-Corgea-Signature:
User-Agent: Corgea-Webhooks/1.0
```
***
## Setting Up a Webhook
 ### Prerequisites
Admin or integration management permissions in your Corgea account
A webhook endpoint URL that accepts POST requests
HTTPS endpoint (required for security)
### Step-by-Step Setup
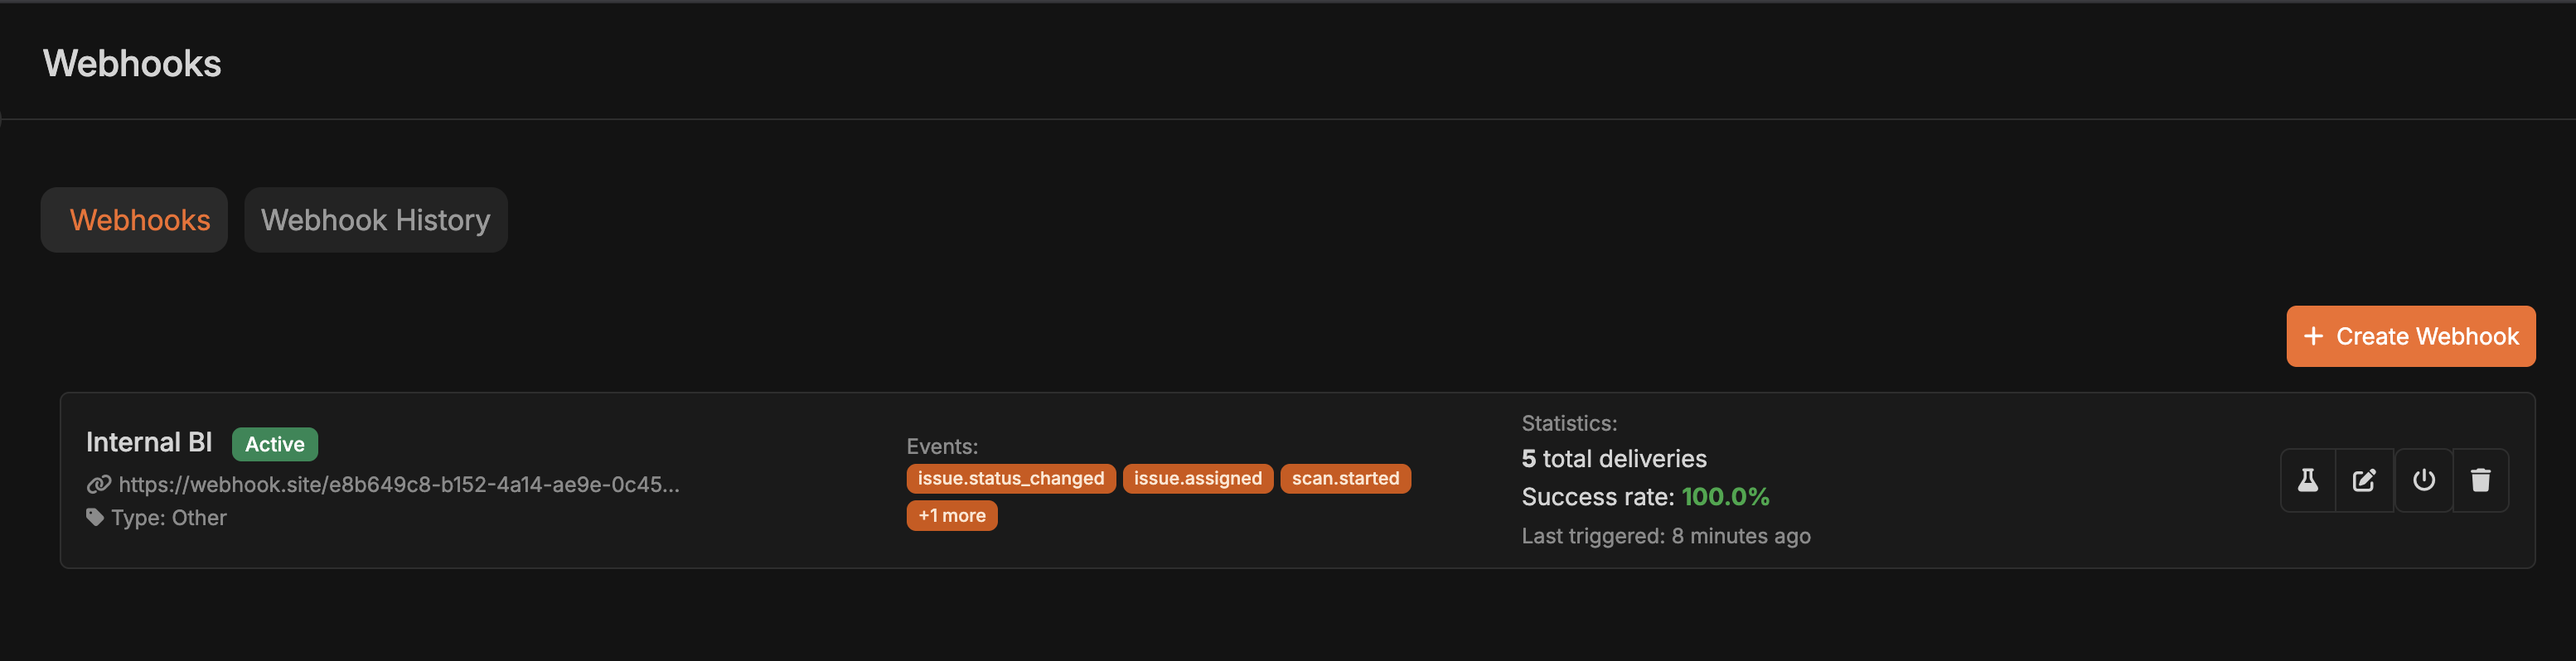
* Open **Settings → Automation → [Integrations](https://www.corgea.app/settings/integrations/)** in Corgea
* Under **Automation Integrations**, open **Webhooks**
### Prerequisites
Admin or integration management permissions in your Corgea account
A webhook endpoint URL that accepts POST requests
HTTPS endpoint (required for security)
### Step-by-Step Setup
* Open **Settings → Automation → [Integrations](https://www.corgea.app/settings/integrations/)** in Corgea
* Under **Automation Integrations**, open **Webhooks**
 The standalone **Slack** and **Zapier** rows are deprecated. Use **Webhooks** for new setups. Existing Slack/Zapier integrations keep working — open **View All** to test or delete them.
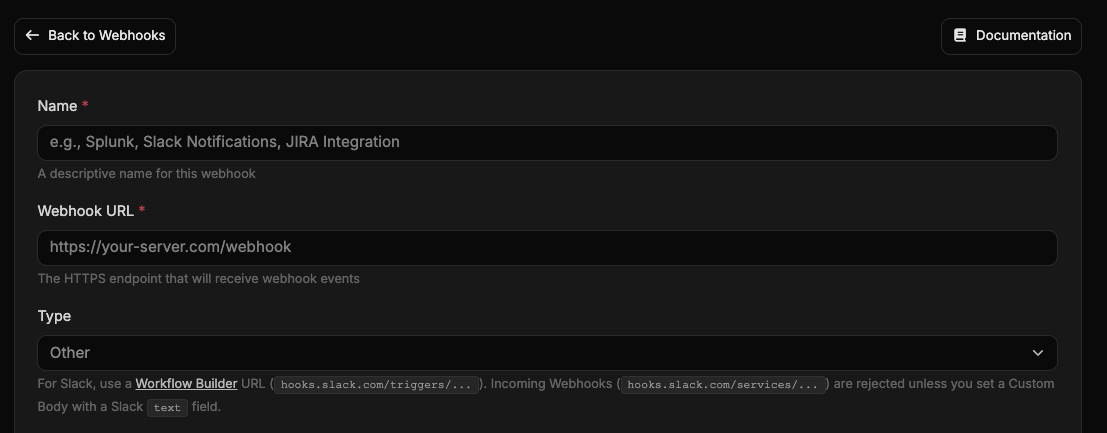 * **Name**: A clear label (for example, "Slack Notifications" or "Production Scan Alerts")
* **Webhook URL**: Your HTTPS endpoint
* **Type**:
* `Slack` — Slack Workflow Builder or Incoming Webhook destinations
* `Zapier` — Zapier Catch Hooks
* `Other` — custom endpoints
For Slack, prefer a Workflow Builder URL (`hooks.slack.com/triggers/...`). Corgea flattens `scan.*` and `webhook.test` for those destinations — map top-level `message`, not nested `data.*`. Non-scan events stay nested. Incoming Webhooks (`hooks.slack.com/services/...`) are rejected unless you set a Custom Body whose rendered JSON has a top-level non-empty string `text` field. `{"text": "{{message}}"}` is allowed only for scan lifecycle events and `scheduled_scan.daily_report`. See [Slack](slack).
* **Name**: A clear label (for example, "Slack Notifications" or "Production Scan Alerts")
* **Webhook URL**: Your HTTPS endpoint
* **Type**:
* `Slack` — Slack Workflow Builder or Incoming Webhook destinations
* `Zapier` — Zapier Catch Hooks
* `Other` — custom endpoints
For Slack, prefer a Workflow Builder URL (`hooks.slack.com/triggers/...`). Corgea flattens `scan.*` and `webhook.test` for those destinations — map top-level `message`, not nested `data.*`. Non-scan events stay nested. Incoming Webhooks (`hooks.slack.com/services/...`) are rejected unless you set a Custom Body whose rendered JSON has a top-level non-empty string `text` field. `{"text": "{{message}}"}` is allowed only for scan lifecycle events and `scheduled_scan.daily_report`. See [Slack](slack).
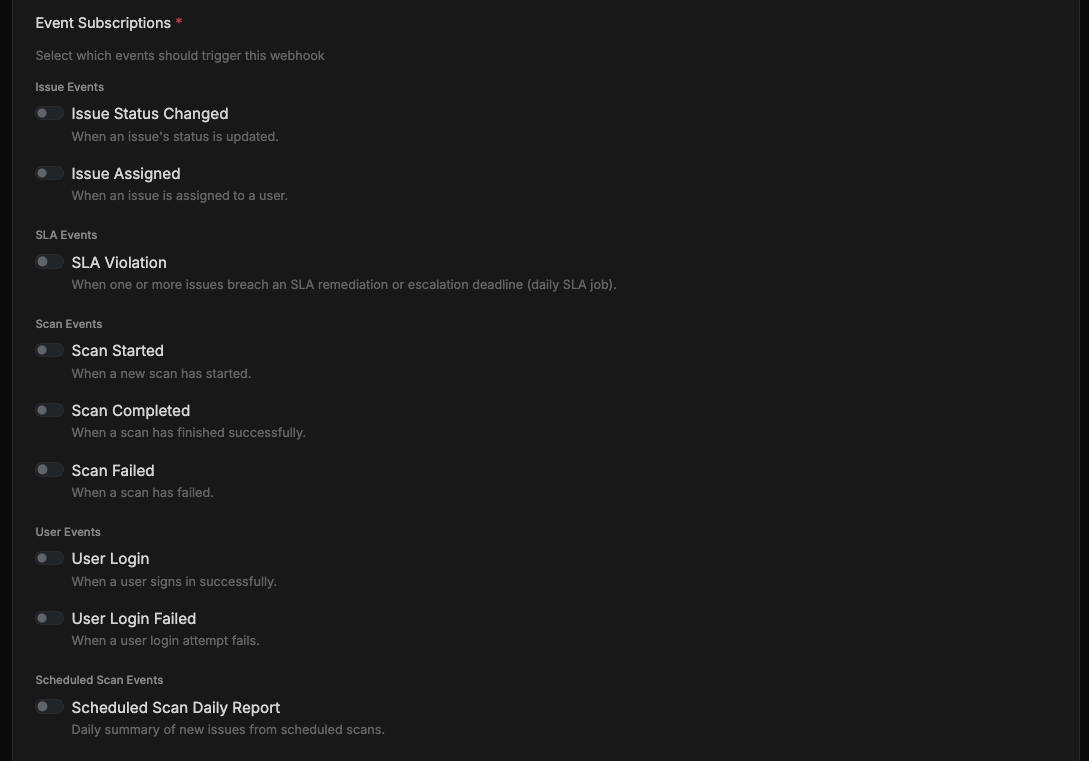 Toggle on the events you care about. You can select more than one:
* Issue Status Changed
* Issue Assigned
* SLA Violation (`sla.violation`)
* Scan Started / Completed / Failed
* User Login / User Login Failed
* Scheduled Scan Daily Report (`scheduled_scan.daily_report`)
Toggle on the events you care about. You can select more than one:
* Issue Status Changed
* Issue Assigned
* SLA Violation (`sla.violation`)
* Scan Started / Completed / Failed
* User Login / User Login Failed
* Scheduled Scan Daily Report (`scheduled_scan.daily_report`)
 **Scan Event Filters** (for `scan.*` events)
* **Only pull request / merge request scans** — skip scans without a `pull_request_id`
* **Only completed scans with true-positive findings** — skip `scan.completed` when `true_positive_count` is 0 (`scan.failed` / `scan.started` are unaffected)
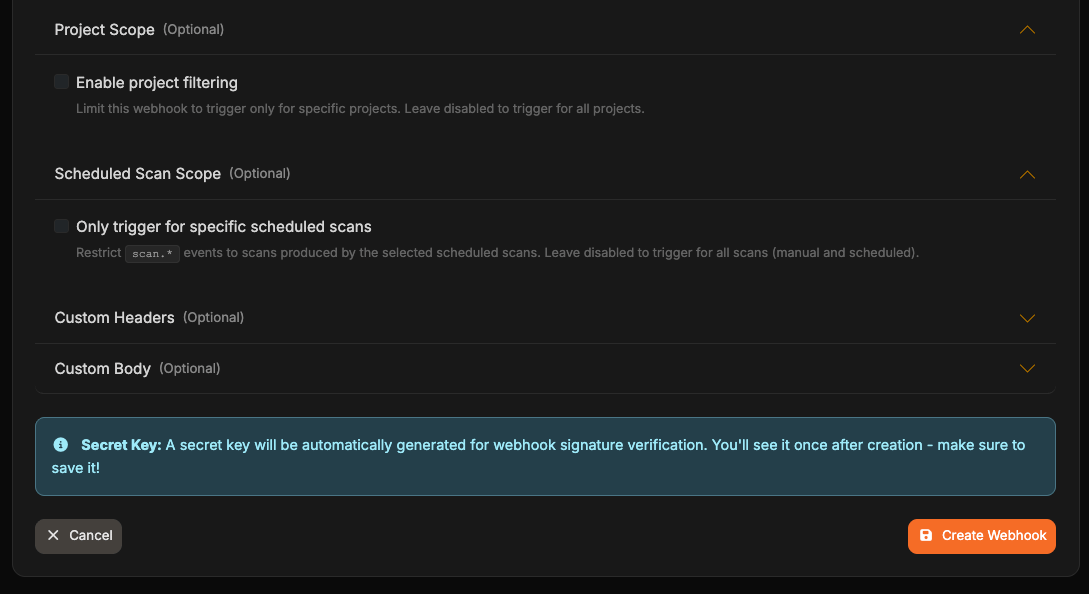
**Project Scope**
* Leave disabled to receive events from all projects
* Enable filtering to limit the webhook to selected projects
* For `sla.violation`, the webhook fires if **any** project in the payload matches
**Status Change Filter** (for `issue.status_changed`)
* Leave empty for all status changes
* Or limit to statuses like `fixed` or `false_positive`
**Scheduled Scan Scope** (for `scan.*` events)
* Leave disabled to receive all scans (manual and scheduled)
* Enable it to only fire for selected scheduled scans
**Custom Headers**
Add headers required by your webhook destination. Each service has different requirements:
**Required Header:**
```text theme={null}
X-Automation-Webhook-Token:
```
**How to get your token:**
1. In Jira, create an automation rule with an "Incoming webhook" trigger
2. Copy the secret token provided by Jira
3. Add it as the header value in Corgea
[Jira Webhook Documentation](https://support.atlassian.com/cloud-automation/docs/configure-the-incoming-webhook-trigger-in-atlassian-automation/)
**No custom headers needed** — auth is in the Slack URL.
Prefer a Workflow Builder URL (`https://hooks.slack.com/triggers/...`). With `Type = Slack`, Corgea flattens `scan.*` and `webhook.test` — map `message`, `pull_request_id`, `scan_url`, `true_positive_count`, `company`. Do **not** map nested `data.*` (Slack returns HTTP 400). Other event types are not flattened. See [Slack](slack).
Incoming Webhooks (`https://hooks.slack.com/services/...`) need a Custom Body whose rendered JSON has a top-level non-empty string `text` field. Use `{"text": "{{message}}"}` only with scan lifecycle events and `scheduled_scan.daily_report`.
**No custom headers needed** - Teams webhook URLs include authentication in the URL itself.
Just paste your Teams webhook URL (format: `https://xxx.webhook.office.com/webhookb2/xxx/IncomingWebhook/xxx`)
Teams incoming webhooks do not validate custom headers. Security is provided by keeping the webhook URL secret.
[Teams Webhook Documentation](https://learn.microsoft.com/en-us/microsoftteams/platform/webhooks-and-connectors/how-to/add-incoming-webhook)
**Header:**
```text theme={null}
Authorization: Bearer
```
Common for REST APIs that use JWT or OAuth tokens.
**Header:**
```text theme={null}
Authorization: Splunk
```
Use this when sending webhook events to a Splunk HTTP Event Collector (HEC) endpoint.
**Headers (choose one):**
```text theme={null}
X-API-Key:
```
or
```text theme={null}
Authorization: ApiKey
```
Common for simple API key authentication.
**No custom headers needed** - PagerDuty Events API v2 uses the `routing_key` in the JSON payload for authentication.
Use the PagerDuty Events API endpoint: `https://events.pagerduty.com/v2/enqueue`
PagerDuty does not validate custom headers. Authentication is handled via the routing\_key in the request body.
[PagerDuty Webhook Documentation](https://developer.pagerduty.com/docs/ZG9jOjExMDI5NTgw-events-api-v2-overview)
**No custom headers needed** - Zapier webhook URLs include authentication in the URL itself.
Create a "Webhooks by Zapier" trigger and use the provided URL.
Zapier Catch Hook does not validate custom headers by default. Security is provided by keeping the webhook URL secret. You can add header validation logic within your Zap if needed.
[Zapier Webhook Documentation](https://zapier.com/help/create/code-webhooks/trigger-zaps-from-webhooks)
If your service isn't listed here, check the service's webhook or incoming webhook documentation for required headers.
**Important:** While Corgea will send any custom headers you configure, not all webhook destinations validate them. Services like Slack, Teams, and Zapier rely on secret URLs rather than header validation. Only add custom headers if your destination service actually requires or validates them (like Jira, custom APIs, etc.).
**Custom Body**
* Optionally provide a JSON object template for the webhook request body
* Leave blank to use Corgea's default payload structure
* Supported placeholders:
* `{{payload}}` (full default payload object)
* `{{time}}` (Unix seconds)
* `{{timestamp}}` (ISO 8601 timestamp)
* `{{event_type}}`
* `{{event_id}}`
* `{{message}}` (from `data.message` when present — scan lifecycle and daily report)
* If the rendered template is invalid JSON, delivery fails and the error appears in webhook history
* Click **Create Webhook**
* Copy the secret key from the popup — Corgea shows it only once
**Scan Event Filters** (for `scan.*` events)
* **Only pull request / merge request scans** — skip scans without a `pull_request_id`
* **Only completed scans with true-positive findings** — skip `scan.completed` when `true_positive_count` is 0 (`scan.failed` / `scan.started` are unaffected)
**Project Scope**
* Leave disabled to receive events from all projects
* Enable filtering to limit the webhook to selected projects
* For `sla.violation`, the webhook fires if **any** project in the payload matches
**Status Change Filter** (for `issue.status_changed`)
* Leave empty for all status changes
* Or limit to statuses like `fixed` or `false_positive`
**Scheduled Scan Scope** (for `scan.*` events)
* Leave disabled to receive all scans (manual and scheduled)
* Enable it to only fire for selected scheduled scans
**Custom Headers**
Add headers required by your webhook destination. Each service has different requirements:
**Required Header:**
```text theme={null}
X-Automation-Webhook-Token:
```
**How to get your token:**
1. In Jira, create an automation rule with an "Incoming webhook" trigger
2. Copy the secret token provided by Jira
3. Add it as the header value in Corgea
[Jira Webhook Documentation](https://support.atlassian.com/cloud-automation/docs/configure-the-incoming-webhook-trigger-in-atlassian-automation/)
**No custom headers needed** — auth is in the Slack URL.
Prefer a Workflow Builder URL (`https://hooks.slack.com/triggers/...`). With `Type = Slack`, Corgea flattens `scan.*` and `webhook.test` — map `message`, `pull_request_id`, `scan_url`, `true_positive_count`, `company`. Do **not** map nested `data.*` (Slack returns HTTP 400). Other event types are not flattened. See [Slack](slack).
Incoming Webhooks (`https://hooks.slack.com/services/...`) need a Custom Body whose rendered JSON has a top-level non-empty string `text` field. Use `{"text": "{{message}}"}` only with scan lifecycle events and `scheduled_scan.daily_report`.
**No custom headers needed** - Teams webhook URLs include authentication in the URL itself.
Just paste your Teams webhook URL (format: `https://xxx.webhook.office.com/webhookb2/xxx/IncomingWebhook/xxx`)
Teams incoming webhooks do not validate custom headers. Security is provided by keeping the webhook URL secret.
[Teams Webhook Documentation](https://learn.microsoft.com/en-us/microsoftteams/platform/webhooks-and-connectors/how-to/add-incoming-webhook)
**Header:**
```text theme={null}
Authorization: Bearer
```
Common for REST APIs that use JWT or OAuth tokens.
**Header:**
```text theme={null}
Authorization: Splunk
```
Use this when sending webhook events to a Splunk HTTP Event Collector (HEC) endpoint.
**Headers (choose one):**
```text theme={null}
X-API-Key:
```
or
```text theme={null}
Authorization: ApiKey
```
Common for simple API key authentication.
**No custom headers needed** - PagerDuty Events API v2 uses the `routing_key` in the JSON payload for authentication.
Use the PagerDuty Events API endpoint: `https://events.pagerduty.com/v2/enqueue`
PagerDuty does not validate custom headers. Authentication is handled via the routing\_key in the request body.
[PagerDuty Webhook Documentation](https://developer.pagerduty.com/docs/ZG9jOjExMDI5NTgw-events-api-v2-overview)
**No custom headers needed** - Zapier webhook URLs include authentication in the URL itself.
Create a "Webhooks by Zapier" trigger and use the provided URL.
Zapier Catch Hook does not validate custom headers by default. Security is provided by keeping the webhook URL secret. You can add header validation logic within your Zap if needed.
[Zapier Webhook Documentation](https://zapier.com/help/create/code-webhooks/trigger-zaps-from-webhooks)
If your service isn't listed here, check the service's webhook or incoming webhook documentation for required headers.
**Important:** While Corgea will send any custom headers you configure, not all webhook destinations validate them. Services like Slack, Teams, and Zapier rely on secret URLs rather than header validation. Only add custom headers if your destination service actually requires or validates them (like Jira, custom APIs, etc.).
**Custom Body**
* Optionally provide a JSON object template for the webhook request body
* Leave blank to use Corgea's default payload structure
* Supported placeholders:
* `{{payload}}` (full default payload object)
* `{{time}}` (Unix seconds)
* `{{timestamp}}` (ISO 8601 timestamp)
* `{{event_type}}`
* `{{event_id}}`
* `{{message}}` (from `data.message` when present — scan lifecycle and daily report)
* If the rendered template is invalid JSON, delivery fails and the error appears in webhook history
* Click **Create Webhook**
* Copy the secret key from the popup — Corgea shows it only once
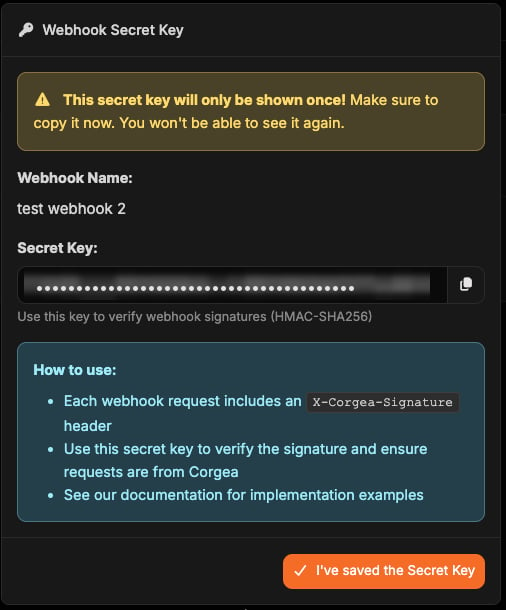 Save the secret key before closing the dialog. You cannot view it again afterward. Contact support if you need to rotate it.
* Click **I've saved the Secret Key**
* The webhook is active and will start receiving events
* Open the webhook and click **Test Webhook**
* Confirm your endpoint returns a 2xx response
* For Slack Workflow Builder: expect a flat body with a non-empty top-level `message` and sample triage keys (`pull_request_id`, `scan_url`, `true_positive_count`, etc.) so you can map variables during Test. Nested-only Workflow Builder configs are unsupported.
### Verifying Webhook Signatures
Use the secret key shown at creation time to verify the `X-Corgea-Signature` header on each request.
```python verify-signature.py theme={null}
import hmac
import hashlib
def verify_webhook_signature(payload, signature, secret):
"""Verify Corgea webhook signature"""
expected_signature = hmac.new(
secret.encode('utf-8'),
payload.encode('utf-8'),
hashlib.sha256
).hexdigest()
return hmac.compare_digest(expected_signature, signature)
# In your webhook handler:
if not verify_webhook_signature(request.body, request.headers['X-Corgea-Signature'], SECRET_KEY):
return HttpResponse(status=403) # Reject invalid signatures
```
```javascript verify-signature.js theme={null}
const crypto = require('crypto');
function verifyWebhookSignature(payload, signature, secret) {
const expectedSignature = crypto
.createHmac('sha256', secret)
.update(payload)
.digest('hex');
return crypto.timingSafeEqual(
Buffer.from(expectedSignature),
Buffer.from(signature)
);
}
```
***
## Use Cases
### 1. Real-time Slack Notifications
**Scenario**: Notify your security team in Slack when high-severity issues are found
**Setup**:
* Create a Slack incoming webhook URL in your Slack workspace
* In Corgea, create a webhook with:
* Type: `Slack`
* URL: Your Slack webhook URL
* Events: `scan.completed`
* Project Filter: Critical production projects
**Result**: Your #security channel gets instant notifications when scans complete
***
### 2. Automated Ticketing for Critical Issues
**Scenario**: Automatically create tickets in Jira/Linear when critical issues are detected
**Setup**:
* Create a Zapier zap or custom endpoint that creates tickets
* In Corgea, create a webhook with:
* Events: `scan.completed`, `issue.status_changed`
* Status Filter: Only `open` status (to avoid duplicate tickets)
* Project Filter: Production projects
**Result**: High/critical issues automatically become tickets in your project management tool
***
### 3. Risk Acceptance Workflow Integration
**Scenario**: Automatically document accepted risks in Jira or Linear when security issues are marked as "Accepted Risk"
**Setup**:
* Create an endpoint or Zapier integration that creates documentation tickets
* In Corgea, create a webhook with:
* Events: `issue.status_changed`
* Status Filter: Only `accepted_risk` status
* Project Filter: All projects or specific high-compliance projects
* Configure the integration to:
* Create a ticket documenting the risk acceptance
* Include issue details (classification, file path, urgency)
* Tag with "risk-acceptance" label
* Assign to security lead for review
**Result**: Every accepted risk is automatically logged in your project management system with full context, creating an audit trail for compliance and risk management reviews
***
### 4. Custom Dashboard Integration
**Scenario**: Display real-time security metrics on your internal dashboard
**Setup**:
* Build an endpoint that receives webhook data and updates your dashboard
* In Corgea, create a webhook with:
* Events: All scan and issue events
* No filters (receive everything)
**Result**: Your dashboard shows live security scan results and issue trends
***
### 5. Multi-team Routing
**Scenario**: Route different project notifications to different teams
**Setup**:
* Create separate webhooks for each team:
* **Backend Team Webhook**: Project filter = backend projects, Slack channel #backend-security
* **Frontend Team Webhook**: Project filter = frontend projects, Slack channel #frontend-security
* **DevOps Team Webhook**: Project filter = infrastructure projects, Slack channel #devops-security
**Result**: Each team only sees security issues relevant to their projects
***
### 6. Compliance Reporting
**Scenario**: Automatically log all security findings to a compliance system
**Setup**:
* Create an endpoint that writes to your compliance database
* In Corgea, create a webhook with:
* Events: `scan.completed`
* All projects
* Store webhook delivery history for audit trail
**Result**: Complete audit trail of all security scans for compliance purposes
***
## Troubleshooting
### Viewing Webhook Delivery History
Navigate to **Integrations** → **Webhooks**
Save the secret key before closing the dialog. You cannot view it again afterward. Contact support if you need to rotate it.
* Click **I've saved the Secret Key**
* The webhook is active and will start receiving events
* Open the webhook and click **Test Webhook**
* Confirm your endpoint returns a 2xx response
* For Slack Workflow Builder: expect a flat body with a non-empty top-level `message` and sample triage keys (`pull_request_id`, `scan_url`, `true_positive_count`, etc.) so you can map variables during Test. Nested-only Workflow Builder configs are unsupported.
### Verifying Webhook Signatures
Use the secret key shown at creation time to verify the `X-Corgea-Signature` header on each request.
```python verify-signature.py theme={null}
import hmac
import hashlib
def verify_webhook_signature(payload, signature, secret):
"""Verify Corgea webhook signature"""
expected_signature = hmac.new(
secret.encode('utf-8'),
payload.encode('utf-8'),
hashlib.sha256
).hexdigest()
return hmac.compare_digest(expected_signature, signature)
# In your webhook handler:
if not verify_webhook_signature(request.body, request.headers['X-Corgea-Signature'], SECRET_KEY):
return HttpResponse(status=403) # Reject invalid signatures
```
```javascript verify-signature.js theme={null}
const crypto = require('crypto');
function verifyWebhookSignature(payload, signature, secret) {
const expectedSignature = crypto
.createHmac('sha256', secret)
.update(payload)
.digest('hex');
return crypto.timingSafeEqual(
Buffer.from(expectedSignature),
Buffer.from(signature)
);
}
```
***
## Use Cases
### 1. Real-time Slack Notifications
**Scenario**: Notify your security team in Slack when high-severity issues are found
**Setup**:
* Create a Slack incoming webhook URL in your Slack workspace
* In Corgea, create a webhook with:
* Type: `Slack`
* URL: Your Slack webhook URL
* Events: `scan.completed`
* Project Filter: Critical production projects
**Result**: Your #security channel gets instant notifications when scans complete
***
### 2. Automated Ticketing for Critical Issues
**Scenario**: Automatically create tickets in Jira/Linear when critical issues are detected
**Setup**:
* Create a Zapier zap or custom endpoint that creates tickets
* In Corgea, create a webhook with:
* Events: `scan.completed`, `issue.status_changed`
* Status Filter: Only `open` status (to avoid duplicate tickets)
* Project Filter: Production projects
**Result**: High/critical issues automatically become tickets in your project management tool
***
### 3. Risk Acceptance Workflow Integration
**Scenario**: Automatically document accepted risks in Jira or Linear when security issues are marked as "Accepted Risk"
**Setup**:
* Create an endpoint or Zapier integration that creates documentation tickets
* In Corgea, create a webhook with:
* Events: `issue.status_changed`
* Status Filter: Only `accepted_risk` status
* Project Filter: All projects or specific high-compliance projects
* Configure the integration to:
* Create a ticket documenting the risk acceptance
* Include issue details (classification, file path, urgency)
* Tag with "risk-acceptance" label
* Assign to security lead for review
**Result**: Every accepted risk is automatically logged in your project management system with full context, creating an audit trail for compliance and risk management reviews
***
### 4. Custom Dashboard Integration
**Scenario**: Display real-time security metrics on your internal dashboard
**Setup**:
* Build an endpoint that receives webhook data and updates your dashboard
* In Corgea, create a webhook with:
* Events: All scan and issue events
* No filters (receive everything)
**Result**: Your dashboard shows live security scan results and issue trends
***
### 5. Multi-team Routing
**Scenario**: Route different project notifications to different teams
**Setup**:
* Create separate webhooks for each team:
* **Backend Team Webhook**: Project filter = backend projects, Slack channel #backend-security
* **Frontend Team Webhook**: Project filter = frontend projects, Slack channel #frontend-security
* **DevOps Team Webhook**: Project filter = infrastructure projects, Slack channel #devops-security
**Result**: Each team only sees security issues relevant to their projects
***
### 6. Compliance Reporting
**Scenario**: Automatically log all security findings to a compliance system
**Setup**:
* Create an endpoint that writes to your compliance database
* In Corgea, create a webhook with:
* Events: `scan.completed`
* All projects
* Store webhook delivery history for audit trail
**Result**: Complete audit trail of all security scans for compliance purposes
***
## Troubleshooting
### Viewing Webhook Delivery History
Navigate to **Integrations** → **Webhooks**
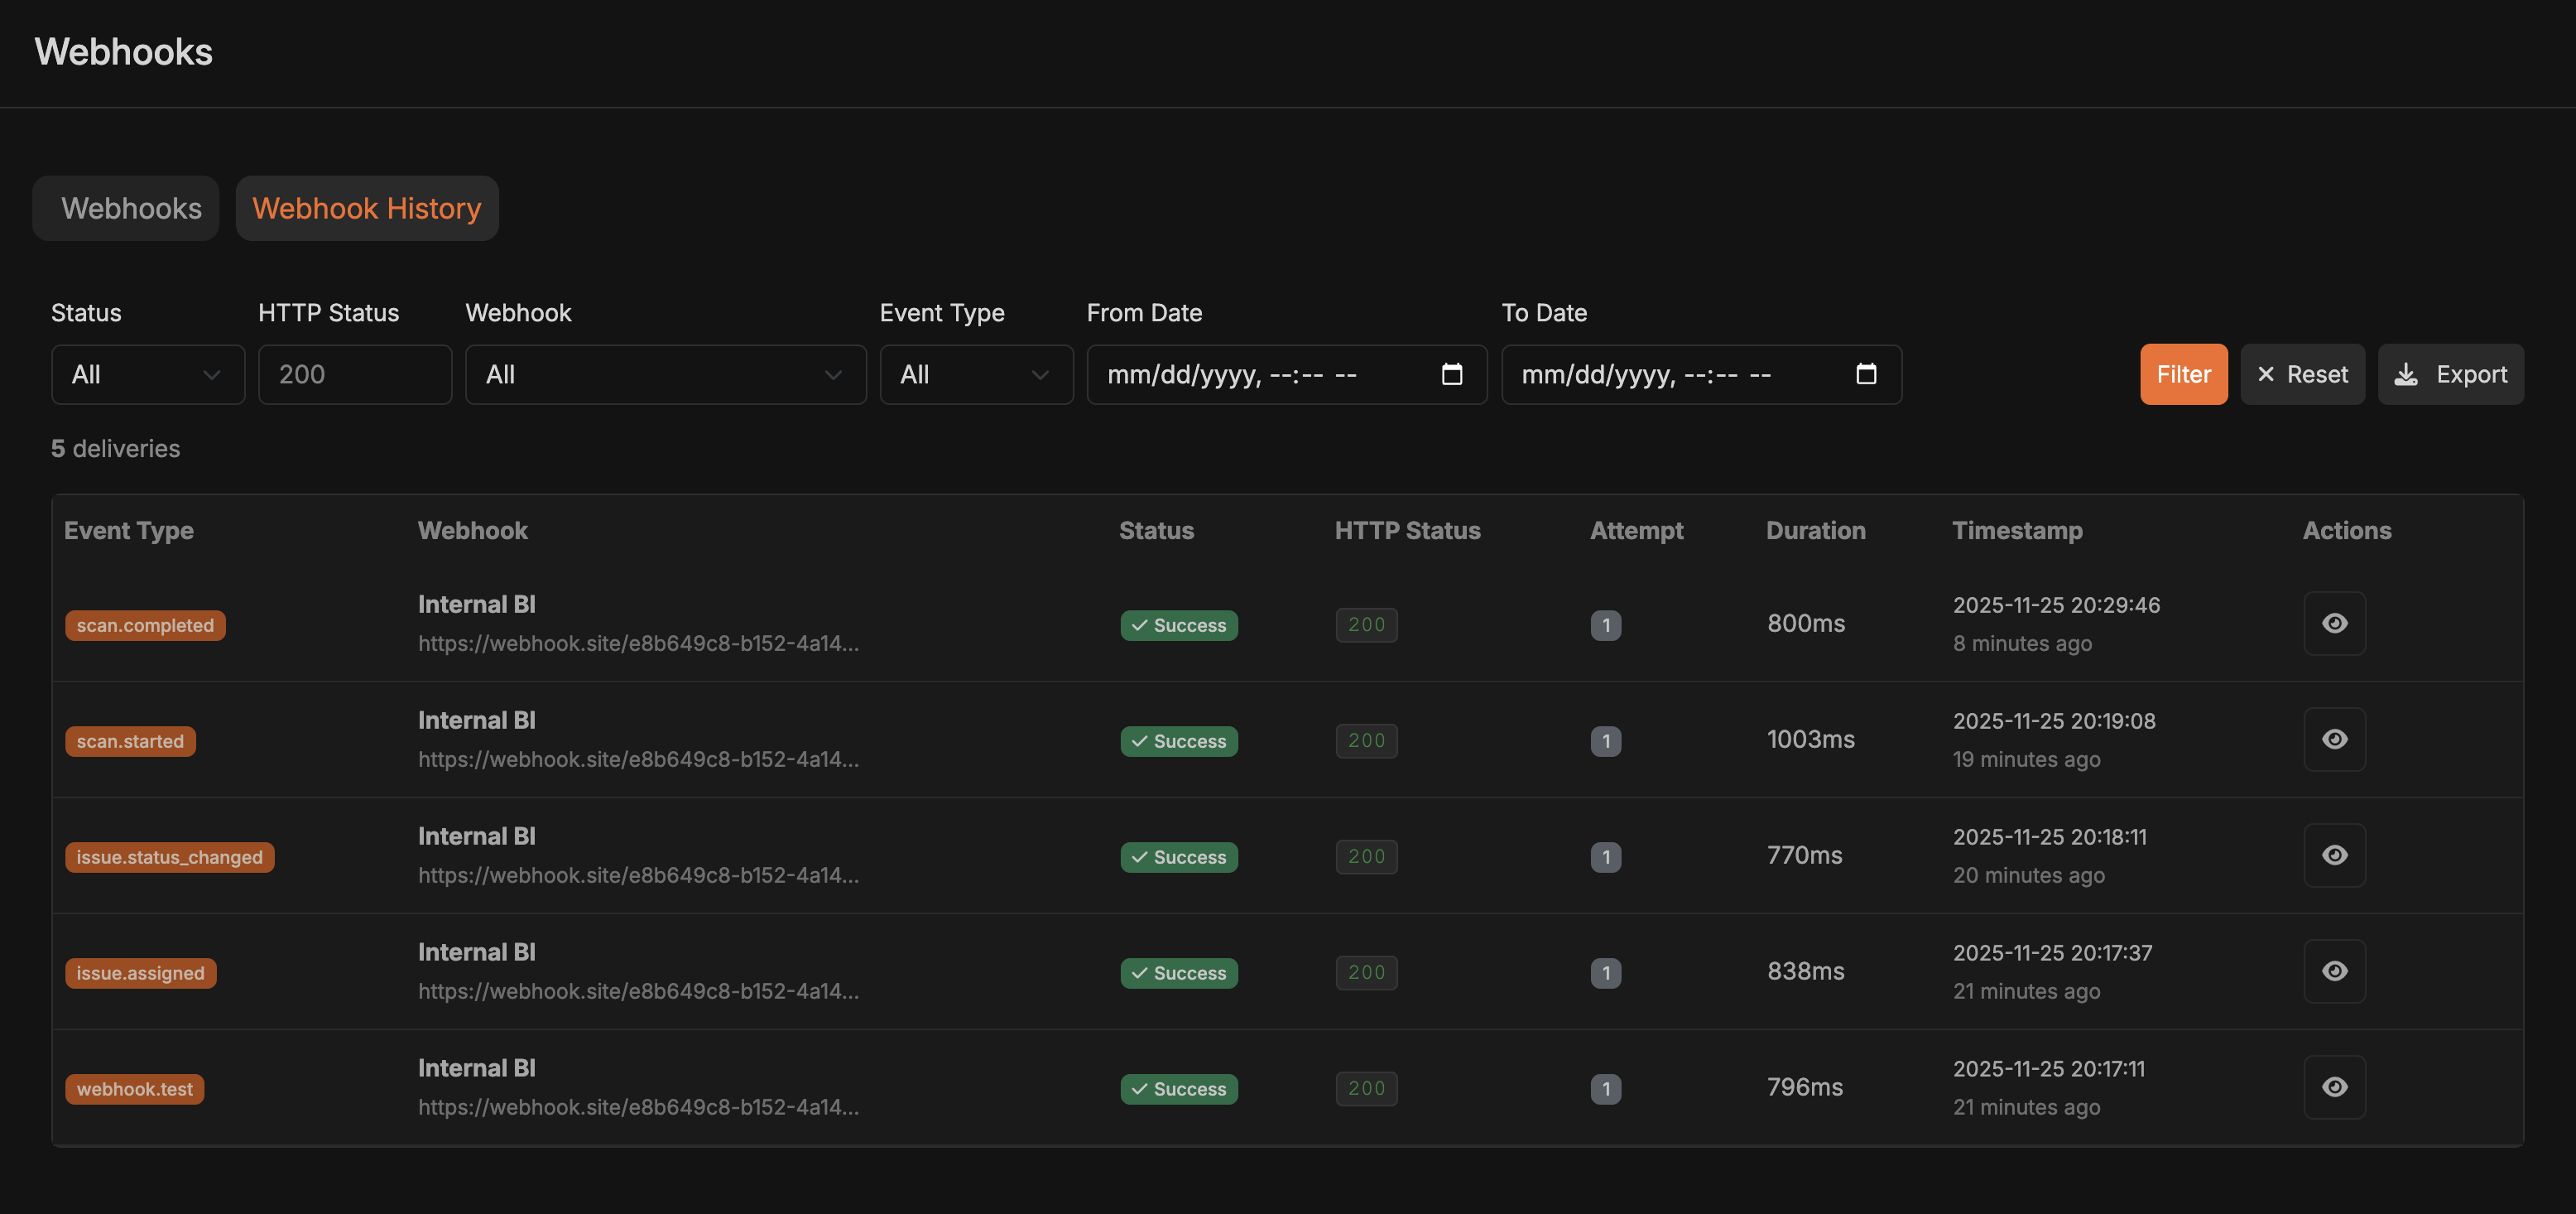 Click on **History** or **Delivery Log**
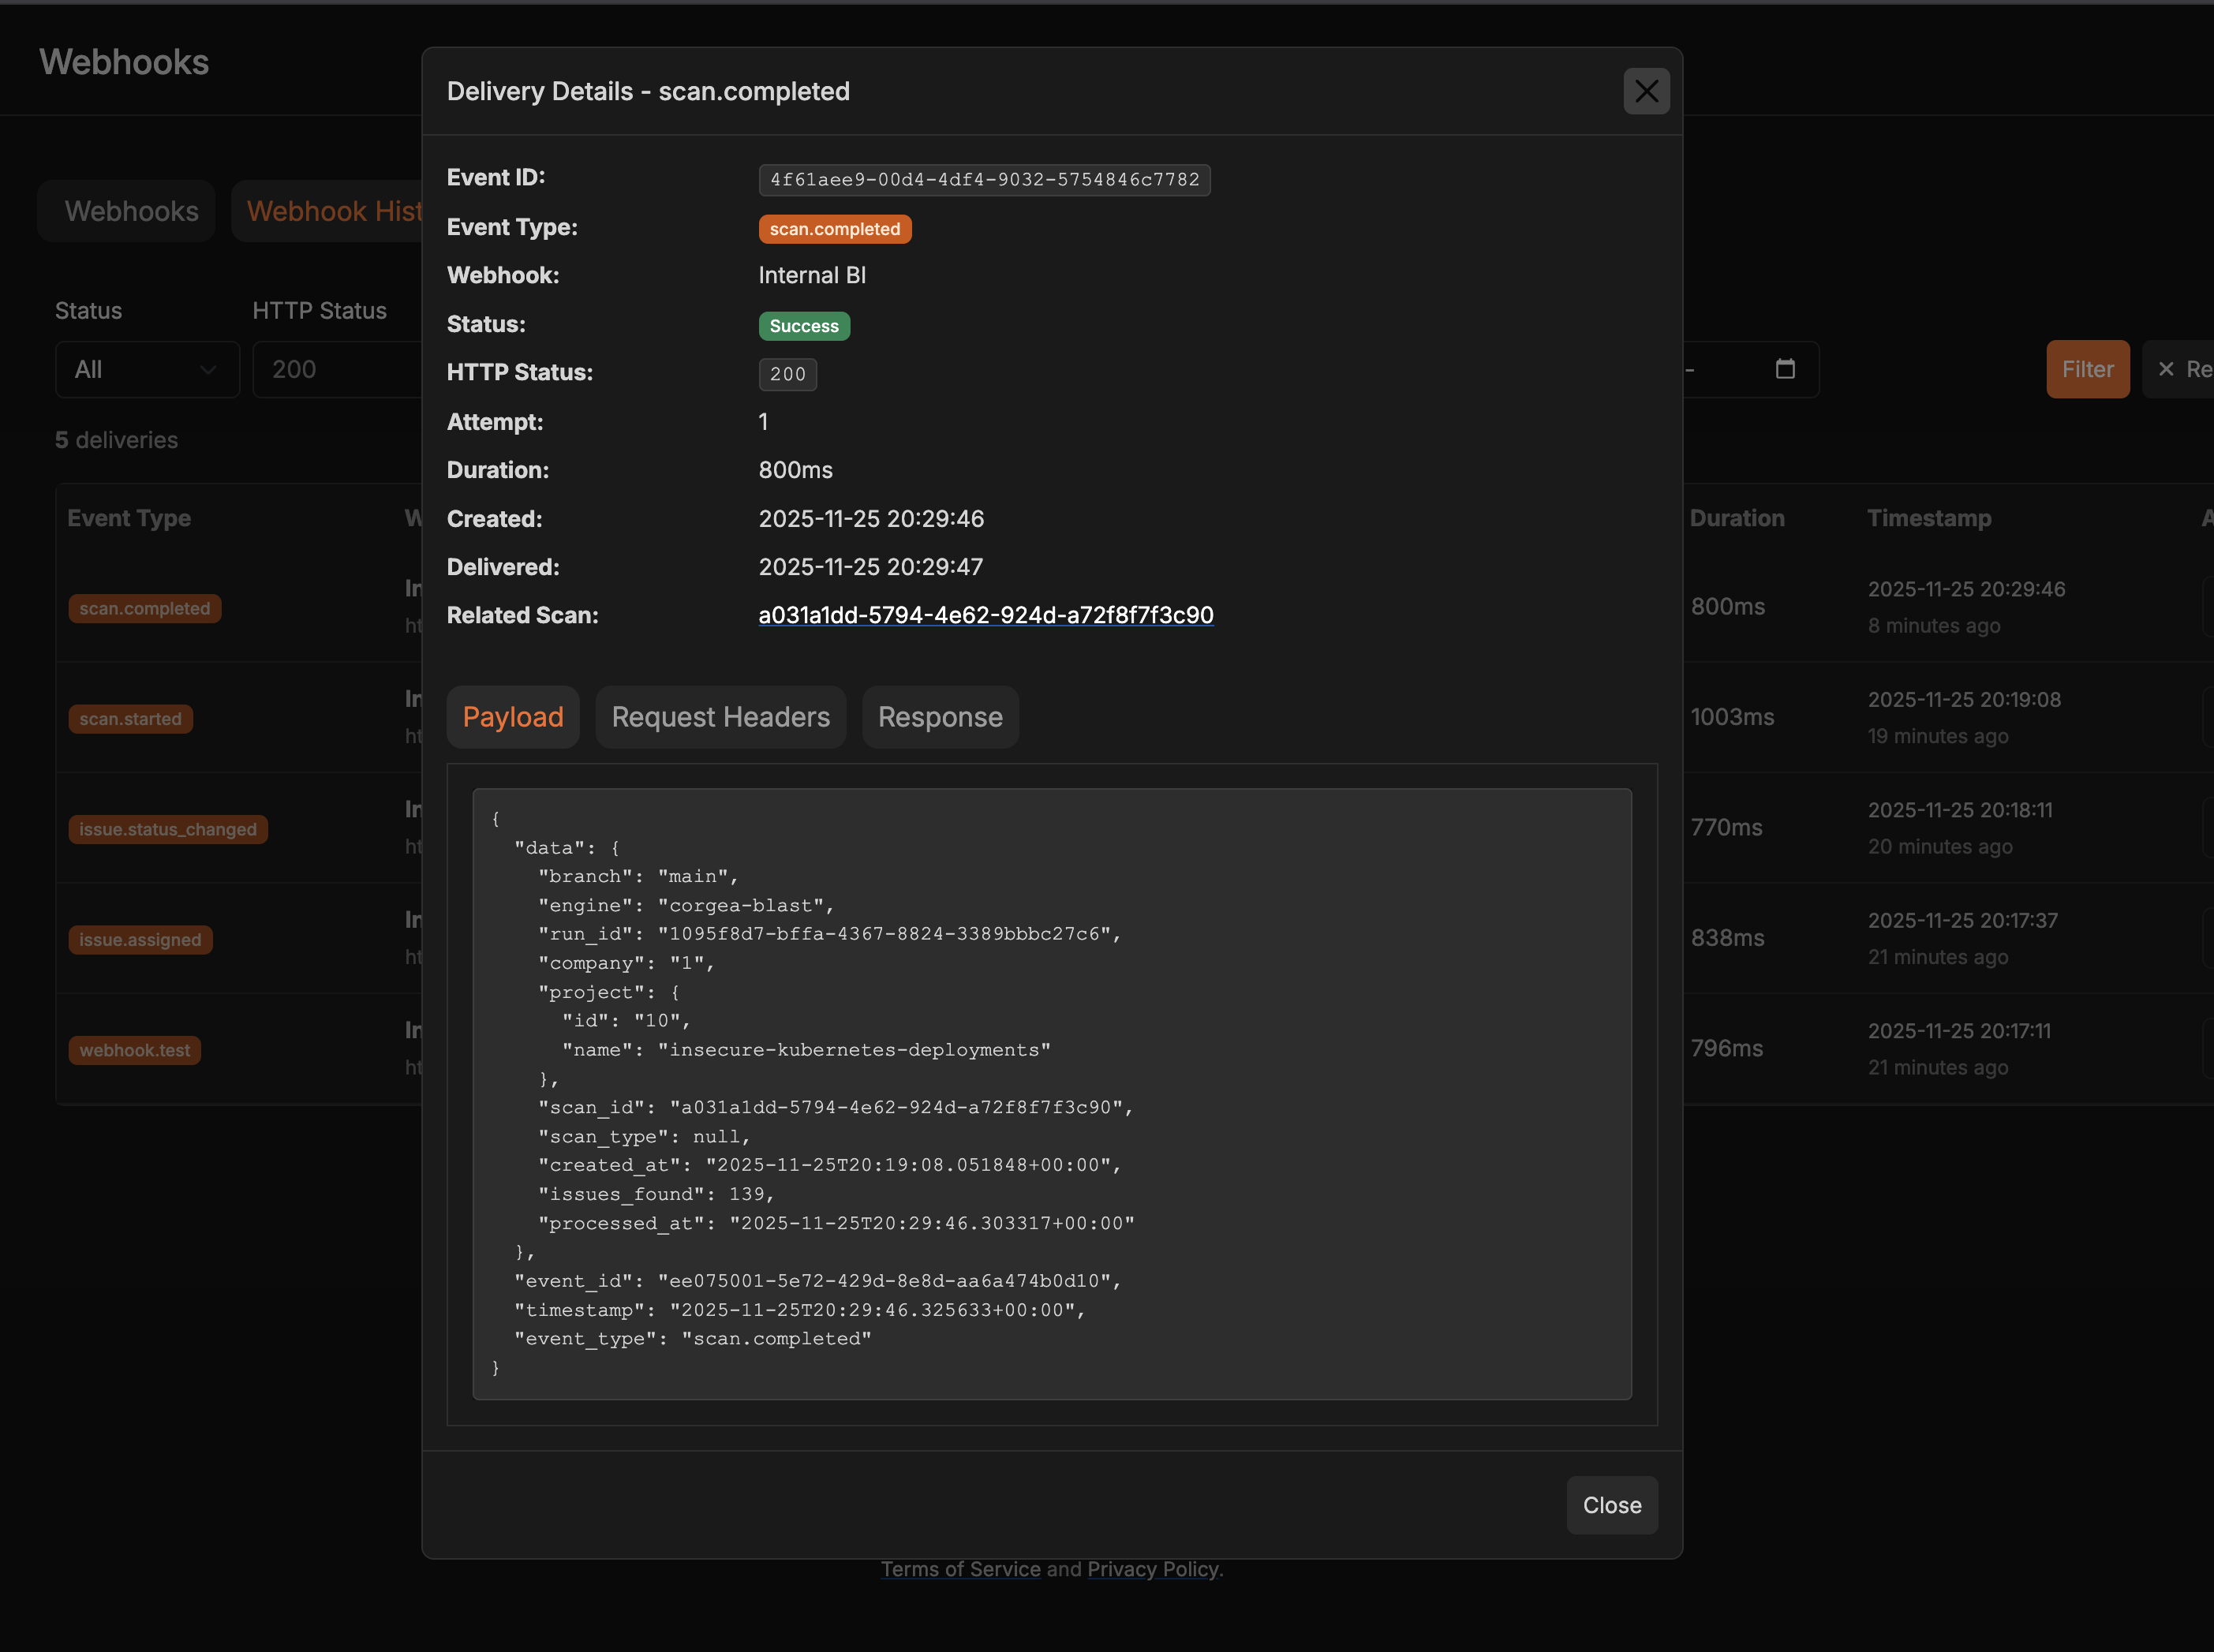 View all webhook delivery attempts with:
* Event type and timestamp
* HTTP status code
* Request/response details
* Error messages (if any)
* Retry attempts
### Common Issues and Solutions
**Possible Causes:**
* Webhook is paused or inactive
* Event subscriptions not configured
* Project, status, or scheduled scan filters excluding events
* Endpoint not returning 2xx status codes
**Solutions:**
1. Check webhook status - ensure it's active (not paused)
2. Verify event subscriptions are selected
3. Review filters - temporarily remove project, status, or scheduled scan filters to test
4. Check your endpoint logs for incoming requests
5. Test the webhook using the "Test Webhook" button
**Cause:** 10 consecutive delivery failures
**Solutions:**
1. Check the delivery history for error details
2. Verify your endpoint URL is correct and accessible
3. Ensure your endpoint returns 2xx status codes
4. Check for firewall/security rules blocking Corgea's requests
5. Fix the underlying issue, then **manually re-activate** the webhook
6. Use "Test Webhook" to verify it's working before re-enabling
**Solutions:**
1. **Use Status Filters**: For `issue.status_changed`, filter to only statuses you care about (e.g., only `fixed` and `false_positive`)
2. **Use Project Filters**: Only subscribe to specific critical projects
3. **Use Scheduled Scan Filters**: For scan events, select the scheduled scans that should trigger the webhook
4. **Reduce Event Subscriptions**: Unsubscribe from events you don't need
5. **Implement Rate Limiting**: On your endpoint, implement rate limiting or queuing
**Possible Causes:**
* Wrong secret key
* Incorrect signature verification logic
* Character encoding issues
**Solutions:**
1. Verify you're using the exact secret key from Corgea
2. Ensure you're using HMAC-SHA256 algorithm
3. Use the raw request body (not parsed JSON) for verification
4. Check for UTF-8 encoding on both sides
5. Use `hmac.compare_digest()` (Python) or `crypto.timingSafeEqual()` (Node.js) for timing-safe comparison
Log both the received signature and your computed signature to compare
**Cause:** Your endpoint takes longer than 10 seconds to respond
**Solutions:**
1. **Acknowledge Immediately**: Return 200 OK immediately, then process asynchronously
2. **Use a Queue**: Add webhook payloads to a queue for background processing
3. **Optimize Processing**: Speed up your webhook handler logic
4. **Increase Resources**: Scale up your endpoint infrastructure
**Best Practice Pattern:**
```python webhook-handler.py theme={null}
@app.route('/webhook', methods=['POST'])
def handle_webhook():
payload = request.json
# Immediately acknowledge receipt
queue.add(process_webhook, payload)
# Return quickly
return '', 200
def process_webhook(payload):
# Do time-consuming work here
...
```
**Possible Causes:**
* Multiple webhooks subscribed to same event
* Retry logic triggering after delayed success
**Solutions:**
1. Check for duplicate webhook configurations
2. Use `event_id` field for idempotency - store processed event IDs and skip duplicates
3. Implement idempotency keys in your endpoint
**Idempotency Pattern:**
```python idempotency.py theme={null}
processed_events = set() # Or use Redis/database
@app.route('/webhook', methods=['POST'])
def handle_webhook():
event_id = request.json['event_id']
if event_id in processed_events:
return '', 200 # Already processed
# Process event...
processed_events.add(event_id)
return '', 200
```
**Solutions:**
1. Check the webhook delivery history for the full payload
2. Some fields may be `null` if data doesn't exist (e.g., unassigned issues)
3. Implement null checks in your handler code
4. Reference the event-specific payload structure in the delivery history
### Getting Webhook Statistics
View performance metrics for your webhooks:
1. Navigate to **Integrations** → **Webhooks**
2. View each webhook's statistics:
* **Total Deliveries**: Total number of webhook calls
* **Successful Deliveries**: Calls that returned 2xx
* **Failed Deliveries**: Calls that failed or timed out
* **Success Rate**: Percentage of successful deliveries
* **Consecutive Failures**: Current failure streak
* **Last Triggered**: When the webhook last fired
***
### Manual Retry
If a webhook delivery failed, you can manually retry it:
1. Go to **Integrations** → **Webhooks** → **History**
2. Find the failed delivery
3. Click **Retry**
4. A new delivery attempt will be created and sent immediately
***
### Exporting Delivery History
For compliance or debugging, export webhook delivery history:
1. Navigate to **Integrations** → **Webhooks** → **History**
2. Apply filters (date range, event type, status, webhook)
3. Click **Export** to download CSV
4. Use the export for:
* Compliance audits
* Performance analysis
* Debugging patterns
* Issue resolution tracking
***
### Testing Tips
1. Use [webhook.site](https://webhook.site) or [RequestBin](https://requestbin.com) to inspect payloads
2. Test with low-volume projects first
3. Monitor delivery success rate for the first few days
4. Set up alerting for webhook failures in your own system
* Webhook URL is correct and accessible
* Endpoint returns 2xx status code within 10 seconds
* Firewall allows Corgea's requests
* Event subscriptions are selected
* Filters are configured correctly (or removed for testing)
* Signature verification works (if using secret)
* Webhook is active (not paused)
***
## Payload Examples
```json issue-status-changed.json theme={null}
{
"event_id": "a1b2c3d4-e5f6-7890-abcd-ef1234567890",
"event_type": "issue.status_changed",
"timestamp": "2025-01-15T14:30:00.000Z",
"data": {
"company": "comp-uuid-1234",
"issue_id": "issue-uuid-5678",
"classification": "SQL Injection",
"urgency": "HI",
"status": "fixed",
"previous_status": "open",
"changed_by": {
"id": "user-uuid-1111",
"email": "jane.doe@company.com",
"name": "Jane Doe"
},
"file_path": "src/controllers/user.py",
"line_num": 45,
"project": {
"id": "proj-uuid-9012",
"name": "Production API"
},
"scan_id": "scan-uuid-3456",
"url": "https://security.example.com/issue/issue-uuid-5678/"
}
}
```
`changed_by` identifies the user who made the status change and is `null` for system-initiated changes. `url` uses your deployment's configured public domain.
```json scan-started.json theme={null}
{
"event_id": "a0b1c2d3-e4f5-6789-abcd-ef0123456789",
"event_type": "scan.started",
"timestamp": "2025-01-15T15:40:00.000Z",
"data": {
"company": "comp-uuid-1234",
"scan_id": "scan-uuid-7890",
"run_id": "run-12345",
"project": {
"id": "proj-uuid-9012",
"name": "Production API"
},
"project_name": "Production API",
"branch": "main",
"engine": "corgea-blast",
"scan_type": "full",
"status": "started",
"pull_request_id": "42",
"scan_url": "https://app.corgea.app/project/proj-uuid-9012/?scan_id=scan-uuid-7890",
"true_positive_count": 0,
"message": "Scan started for Production API (PR #42).",
"scheduled_scan_ids": ["scheduled-scan-uuid"],
"created_at": "2025-01-15T15:40:00.000Z"
}
}
```
```json scan-completed.json theme={null}
{
"event_id": "b2c3d4e5-f6a7-8901-bcde-f12345678901",
"event_type": "scan.completed",
"timestamp": "2025-01-15T15:45:00.000Z",
"data": {
"company": "comp-uuid-1234",
"scan_id": "scan-uuid-7890",
"run_id": "run-12345",
"project": {
"id": "proj-uuid-9012",
"name": "Production API"
},
"project_name": "Production API",
"branch": "main",
"engine": "corgea-blast",
"scan_type": "full",
"status": "completed",
"pull_request_id": "42",
"scan_url": "https://app.corgea.app/project/proj-uuid-9012/?scan_id=scan-uuid-7890",
"true_positive_count": 5,
"summary": {
"total_issues": 8,
"issues_with_fixes": 5,
"issues_without_fixes": 3,
"severity_breakdown": {
"HI": {
"name": "High",
"count": 2
},
"ME": {
"name": "Medium",
"count": 6
}
},
"classification_breakdown": [
{
"classification": "SQL Injection",
"count": 2
},
{
"classification": "Cross-Site Scripting (XSS)",
"count": 1
}
]
},
"message": "Scan completed for Production API (PR #42): 5 true-positive findings (5 with fixes). View: https://app.corgea.app/project/proj-uuid-9012/?scan_id=scan-uuid-7890",
"scheduled_scan_ids": ["scheduled-scan-uuid"],
"processed_at": "2025-01-15T15:45:00.000Z",
"created_at": "2025-01-15T15:40:00.000Z"
}
}
```
Nested envelope shown above is what Zapier / Other receive (and what Corgea stores in delivery history). Slack Workflow Builder gets triage fields as **top-level** keys on the HTTP request body for `scan.*` / `webhook.test` only (`message`, `scan_id`, `scan_url`, `pull_request_id`, `true_positive_count`, `status`, `branch`, `project_name`, `company`, `run_id`, `engine`, `scan_type`, plus `error` on `scan.failed` when present, and `company_id` / `test` / `webhook_name` on `webhook.test` — not nested `summary` / `project` / `scheduled_scan_ids` / `scan_errors` / `created_at` / `processed_at`). `data.message` / top-level `message` is a plain-text summary; the "(N with fixes)" suffix counts fixes among true-positive findings only (not all issues on the scan).
```json scan-failed.json theme={null}
{
"event_id": "c1d2e3f4-a5b6-7890-cdef-1234567890ab",
"event_type": "scan.failed",
"timestamp": "2025-01-15T15:42:00.000Z",
"data": {
"company": "comp-uuid-1234",
"scan_id": "scan-uuid-7890",
"run_id": "run-12345",
"project": {
"id": "proj-uuid-9012",
"name": "Production API"
},
"project_name": "Production API",
"branch": "main",
"engine": "corgea-blast",
"scan_type": "full",
"status": "failed",
"pull_request_id": "42",
"scan_url": "https://app.corgea.app/project/proj-uuid-9012/?scan_id=scan-uuid-7890",
"true_positive_count": 0,
"error": "Scanner timed out",
"scan_errors": null,
"message": "Scan failed for Production API (PR #42): Scanner timed out. View: https://app.corgea.app/project/proj-uuid-9012/?scan_id=scan-uuid-7890",
"scheduled_scan_ids": ["scheduled-scan-uuid"],
"created_at": "2025-01-15T15:40:00.000Z"
}
}
```
`data.message` includes the failure reason (truncated when longer than 200 characters) and the scan URL when available. Use `data.error` / `data.scan_errors` for the raw failure details. On Slack Workflow Builder, `error` is also available as a top-level flat field.
```json issue-assigned.json theme={null}
{
"event_id": "c3d4e5f6-a7b8-9012-cdef-123456789012",
"event_type": "issue.assigned",
"timestamp": "2025-01-15T16:00:00.000Z",
"data": {
"company": "comp-uuid-1234",
"issue_id": "issue-uuid-5678",
"classification": "Cross-Site Scripting (XSS)",
"urgency": "ME",
"status": "open",
"assigned_to": {
"id": "user-uuid-1111",
"email": "jane.doe@company.com",
"name": "Jane Doe"
},
"previously_assigned_to": {
"id": "user-uuid-2222",
"email": "john.smith@company.com",
"name": "John Smith"
},
"project": {
"id": "proj-uuid-9012",
"name": "Production API"
},
"url": "https://app.corgea.com/issue/issue-uuid-5678/"
}
}
```
```json sla-violation.json theme={null}
{
"event_id": "f6a7b8c9-d0e1-2345-f012-345678901234",
"event_type": "sla.violation",
"timestamp": "2025-01-15T16:20:00.000Z",
"data": {
"company": "comp-uuid-1234",
"sla": {
"id": 3,
"rule_type": "sca",
"urgency": ["CR", "HI"],
"remediation_days": 14,
"escalation_days": 7
},
"notification_type": "escalation",
"issue_kind": "SCA",
"issue_count": 12,
"summary_message": "Plain-text summary of breached issues...",
"projects": [
{
"id": "proj-uuid-9012",
"name": "Production API",
"url": "https://app.corgea.com/project/proj-uuid-9012",
"issue_count": 12,
"urgency_counts": {
"Critical": 4,
"High": 8
}
}
]
}
}
```
```json user-login.json theme={null}
{
"event_id": "d4e5f6a7-b8c9-0123-def0-123456789012",
"event_type": "user.login",
"timestamp": "2025-01-15T16:10:00.000Z",
"data": {
"company": "comp-uuid-1234",
"user_id": 123,
"username": "jane.doe",
"email": "jane.doe@company.com",
"first_name": "Jane",
"last_name": "Doe",
"user_agent": "Mozilla/5.0",
"path": "/login/"
}
}
```
```json user-login-failed.json theme={null}
{
"event_id": "e5f6a7b8-c9d0-1234-ef01-234567890123",
"event_type": "user.login_failed",
"timestamp": "2025-01-15T16:12:00.000Z",
"data": {
"company": "comp-uuid-1234",
"username": "jane.doe",
"user_agent": "Mozilla/5.0",
"path": "/login/"
}
}
```
```json scheduled-scan-daily-report.json theme={null}
{
"event_id": "3282dbbb-7392-476b-8ce2-19fc1070342c",
"event_type": "scheduled_scan.daily_report",
"timestamp": "2026-05-13T12:29:53.083616+00:00",
"data": {
"title": "🐕 Corgea Daily Scan Report",
"company": "123",
"company_name": "Acme Corp",
"total_new_issues": 7,
"message": "Daily scan report for Acme Corp: 7 new issues detected across 2 scan runs.",
"scan_runs": [
{
"scheduled_scan_name": "Nightly API Scan",
"project": "api-service",
"new_issue_count": 5,
"scan_url": "https://app.corgea.com/scans/abc123"
},
{
"scheduled_scan_name": "Nightly Frontend Scan",
"project": "frontend",
"new_issue_count": 2,
"scan_url": "https://app.corgea.com/scans/def456"
}
]
}
}
```
The outer envelope (`event_id`, `event_type`, `timestamp`, `data`) follows the [standard payload structure](#payload-structure). The `data` object contains:
| Field | Type | Description |
| --------------------------------- | -------------- | ------------------------------------------------------------------------- |
| `title` | string | Display title for the report |
| `company` | string | Company ID |
| `company_name` | string | Display name of the company |
| `total_new_issues` | integer | Sum of new issues across all scan runs in the payload |
| `message` | string | Human-readable summary suitable for plain-text notifications (e.g. Slack) |
| `scan_runs` | array | One entry per scan run that produced at least one new finding |
| `scan_runs[].scheduled_scan_name` | string | Name of the scheduled scan configuration |
| `scan_runs[].project` | string \| null | Project name, or `null` if no project is linked |
| `scan_runs[].new_issue_count` | integer | Number of new issues found in this run |
| `scan_runs[].scan_url` | string \| null | Deep link to the scan results in Corgea, or `null` if unavailable |
***
## FAQ
Yes! Your endpoint will receive an `X-Corgea-Event` header and `event_type` field to identify the event.
There's no hard limit, but we recommend organizing by purpose (e.g., one per team or tool).
Corgea will retry 3 times with exponential backoff. After 10 consecutive failures, the webhook auto-pauses.
Yes! Use the "Test Webhook" button to send a sample payload without waiting for real events. For Slack Workflow Builder, the sample is flat and includes a non-empty `message` plus triage keys (`pull_request_id`, `scan_url`, `true_positive_count`, `company`). `company_id` is also included (same value) for older Test consumers.
Yes. Under **Scan Event Filters**, enable **Only pull request / merge request scans** and **Only completed scans with true-positive findings**. Subscribe to `scan.failed` and `scan.completed`. The findings filter does not apply to `scan.failed`.
Yes! Corgea auto-generates a secret key for HMAC signature verification (`X-Corgea-Signature`). You can also add custom headers for destination-specific auth tokens.
Not directly, but you can filter by project. You can also filter on the received payload in your endpoint.
Payloads are sent over HTTPS (TLS), providing encryption in transit. Use HMAC signatures for verification.
Delivery logs are retained for compliance and debugging. Check with your plan for specific retention periods.
Yes! Go to the webhook delivery history and click "Retry" on any failed delivery.
Contact support for the current list of IP addresses to whitelist in your firewall.
***
**Questions or issues?** Contact [Corgea Support](mailto:support@corgea.com)
View all webhook delivery attempts with:
* Event type and timestamp
* HTTP status code
* Request/response details
* Error messages (if any)
* Retry attempts
### Common Issues and Solutions
**Possible Causes:**
* Webhook is paused or inactive
* Event subscriptions not configured
* Project, status, or scheduled scan filters excluding events
* Endpoint not returning 2xx status codes
**Solutions:**
1. Check webhook status - ensure it's active (not paused)
2. Verify event subscriptions are selected
3. Review filters - temporarily remove project, status, or scheduled scan filters to test
4. Check your endpoint logs for incoming requests
5. Test the webhook using the "Test Webhook" button
**Cause:** 10 consecutive delivery failures
**Solutions:**
1. Check the delivery history for error details
2. Verify your endpoint URL is correct and accessible
3. Ensure your endpoint returns 2xx status codes
4. Check for firewall/security rules blocking Corgea's requests
5. Fix the underlying issue, then **manually re-activate** the webhook
6. Use "Test Webhook" to verify it's working before re-enabling
**Solutions:**
1. **Use Status Filters**: For `issue.status_changed`, filter to only statuses you care about (e.g., only `fixed` and `false_positive`)
2. **Use Project Filters**: Only subscribe to specific critical projects
3. **Use Scheduled Scan Filters**: For scan events, select the scheduled scans that should trigger the webhook
4. **Reduce Event Subscriptions**: Unsubscribe from events you don't need
5. **Implement Rate Limiting**: On your endpoint, implement rate limiting or queuing
**Possible Causes:**
* Wrong secret key
* Incorrect signature verification logic
* Character encoding issues
**Solutions:**
1. Verify you're using the exact secret key from Corgea
2. Ensure you're using HMAC-SHA256 algorithm
3. Use the raw request body (not parsed JSON) for verification
4. Check for UTF-8 encoding on both sides
5. Use `hmac.compare_digest()` (Python) or `crypto.timingSafeEqual()` (Node.js) for timing-safe comparison
Log both the received signature and your computed signature to compare
**Cause:** Your endpoint takes longer than 10 seconds to respond
**Solutions:**
1. **Acknowledge Immediately**: Return 200 OK immediately, then process asynchronously
2. **Use a Queue**: Add webhook payloads to a queue for background processing
3. **Optimize Processing**: Speed up your webhook handler logic
4. **Increase Resources**: Scale up your endpoint infrastructure
**Best Practice Pattern:**
```python webhook-handler.py theme={null}
@app.route('/webhook', methods=['POST'])
def handle_webhook():
payload = request.json
# Immediately acknowledge receipt
queue.add(process_webhook, payload)
# Return quickly
return '', 200
def process_webhook(payload):
# Do time-consuming work here
...
```
**Possible Causes:**
* Multiple webhooks subscribed to same event
* Retry logic triggering after delayed success
**Solutions:**
1. Check for duplicate webhook configurations
2. Use `event_id` field for idempotency - store processed event IDs and skip duplicates
3. Implement idempotency keys in your endpoint
**Idempotency Pattern:**
```python idempotency.py theme={null}
processed_events = set() # Or use Redis/database
@app.route('/webhook', methods=['POST'])
def handle_webhook():
event_id = request.json['event_id']
if event_id in processed_events:
return '', 200 # Already processed
# Process event...
processed_events.add(event_id)
return '', 200
```
**Solutions:**
1. Check the webhook delivery history for the full payload
2. Some fields may be `null` if data doesn't exist (e.g., unassigned issues)
3. Implement null checks in your handler code
4. Reference the event-specific payload structure in the delivery history
### Getting Webhook Statistics
View performance metrics for your webhooks:
1. Navigate to **Integrations** → **Webhooks**
2. View each webhook's statistics:
* **Total Deliveries**: Total number of webhook calls
* **Successful Deliveries**: Calls that returned 2xx
* **Failed Deliveries**: Calls that failed or timed out
* **Success Rate**: Percentage of successful deliveries
* **Consecutive Failures**: Current failure streak
* **Last Triggered**: When the webhook last fired
***
### Manual Retry
If a webhook delivery failed, you can manually retry it:
1. Go to **Integrations** → **Webhooks** → **History**
2. Find the failed delivery
3. Click **Retry**
4. A new delivery attempt will be created and sent immediately
***
### Exporting Delivery History
For compliance or debugging, export webhook delivery history:
1. Navigate to **Integrations** → **Webhooks** → **History**
2. Apply filters (date range, event type, status, webhook)
3. Click **Export** to download CSV
4. Use the export for:
* Compliance audits
* Performance analysis
* Debugging patterns
* Issue resolution tracking
***
### Testing Tips
1. Use [webhook.site](https://webhook.site) or [RequestBin](https://requestbin.com) to inspect payloads
2. Test with low-volume projects first
3. Monitor delivery success rate for the first few days
4. Set up alerting for webhook failures in your own system
* Webhook URL is correct and accessible
* Endpoint returns 2xx status code within 10 seconds
* Firewall allows Corgea's requests
* Event subscriptions are selected
* Filters are configured correctly (or removed for testing)
* Signature verification works (if using secret)
* Webhook is active (not paused)
***
## Payload Examples
```json issue-status-changed.json theme={null}
{
"event_id": "a1b2c3d4-e5f6-7890-abcd-ef1234567890",
"event_type": "issue.status_changed",
"timestamp": "2025-01-15T14:30:00.000Z",
"data": {
"company": "comp-uuid-1234",
"issue_id": "issue-uuid-5678",
"classification": "SQL Injection",
"urgency": "HI",
"status": "fixed",
"previous_status": "open",
"changed_by": {
"id": "user-uuid-1111",
"email": "jane.doe@company.com",
"name": "Jane Doe"
},
"file_path": "src/controllers/user.py",
"line_num": 45,
"project": {
"id": "proj-uuid-9012",
"name": "Production API"
},
"scan_id": "scan-uuid-3456",
"url": "https://security.example.com/issue/issue-uuid-5678/"
}
}
```
`changed_by` identifies the user who made the status change and is `null` for system-initiated changes. `url` uses your deployment's configured public domain.
```json scan-started.json theme={null}
{
"event_id": "a0b1c2d3-e4f5-6789-abcd-ef0123456789",
"event_type": "scan.started",
"timestamp": "2025-01-15T15:40:00.000Z",
"data": {
"company": "comp-uuid-1234",
"scan_id": "scan-uuid-7890",
"run_id": "run-12345",
"project": {
"id": "proj-uuid-9012",
"name": "Production API"
},
"project_name": "Production API",
"branch": "main",
"engine": "corgea-blast",
"scan_type": "full",
"status": "started",
"pull_request_id": "42",
"scan_url": "https://app.corgea.app/project/proj-uuid-9012/?scan_id=scan-uuid-7890",
"true_positive_count": 0,
"message": "Scan started for Production API (PR #42).",
"scheduled_scan_ids": ["scheduled-scan-uuid"],
"created_at": "2025-01-15T15:40:00.000Z"
}
}
```
```json scan-completed.json theme={null}
{
"event_id": "b2c3d4e5-f6a7-8901-bcde-f12345678901",
"event_type": "scan.completed",
"timestamp": "2025-01-15T15:45:00.000Z",
"data": {
"company": "comp-uuid-1234",
"scan_id": "scan-uuid-7890",
"run_id": "run-12345",
"project": {
"id": "proj-uuid-9012",
"name": "Production API"
},
"project_name": "Production API",
"branch": "main",
"engine": "corgea-blast",
"scan_type": "full",
"status": "completed",
"pull_request_id": "42",
"scan_url": "https://app.corgea.app/project/proj-uuid-9012/?scan_id=scan-uuid-7890",
"true_positive_count": 5,
"summary": {
"total_issues": 8,
"issues_with_fixes": 5,
"issues_without_fixes": 3,
"severity_breakdown": {
"HI": {
"name": "High",
"count": 2
},
"ME": {
"name": "Medium",
"count": 6
}
},
"classification_breakdown": [
{
"classification": "SQL Injection",
"count": 2
},
{
"classification": "Cross-Site Scripting (XSS)",
"count": 1
}
]
},
"message": "Scan completed for Production API (PR #42): 5 true-positive findings (5 with fixes). View: https://app.corgea.app/project/proj-uuid-9012/?scan_id=scan-uuid-7890",
"scheduled_scan_ids": ["scheduled-scan-uuid"],
"processed_at": "2025-01-15T15:45:00.000Z",
"created_at": "2025-01-15T15:40:00.000Z"
}
}
```
Nested envelope shown above is what Zapier / Other receive (and what Corgea stores in delivery history). Slack Workflow Builder gets triage fields as **top-level** keys on the HTTP request body for `scan.*` / `webhook.test` only (`message`, `scan_id`, `scan_url`, `pull_request_id`, `true_positive_count`, `status`, `branch`, `project_name`, `company`, `run_id`, `engine`, `scan_type`, plus `error` on `scan.failed` when present, and `company_id` / `test` / `webhook_name` on `webhook.test` — not nested `summary` / `project` / `scheduled_scan_ids` / `scan_errors` / `created_at` / `processed_at`). `data.message` / top-level `message` is a plain-text summary; the "(N with fixes)" suffix counts fixes among true-positive findings only (not all issues on the scan).
```json scan-failed.json theme={null}
{
"event_id": "c1d2e3f4-a5b6-7890-cdef-1234567890ab",
"event_type": "scan.failed",
"timestamp": "2025-01-15T15:42:00.000Z",
"data": {
"company": "comp-uuid-1234",
"scan_id": "scan-uuid-7890",
"run_id": "run-12345",
"project": {
"id": "proj-uuid-9012",
"name": "Production API"
},
"project_name": "Production API",
"branch": "main",
"engine": "corgea-blast",
"scan_type": "full",
"status": "failed",
"pull_request_id": "42",
"scan_url": "https://app.corgea.app/project/proj-uuid-9012/?scan_id=scan-uuid-7890",
"true_positive_count": 0,
"error": "Scanner timed out",
"scan_errors": null,
"message": "Scan failed for Production API (PR #42): Scanner timed out. View: https://app.corgea.app/project/proj-uuid-9012/?scan_id=scan-uuid-7890",
"scheduled_scan_ids": ["scheduled-scan-uuid"],
"created_at": "2025-01-15T15:40:00.000Z"
}
}
```
`data.message` includes the failure reason (truncated when longer than 200 characters) and the scan URL when available. Use `data.error` / `data.scan_errors` for the raw failure details. On Slack Workflow Builder, `error` is also available as a top-level flat field.
```json issue-assigned.json theme={null}
{
"event_id": "c3d4e5f6-a7b8-9012-cdef-123456789012",
"event_type": "issue.assigned",
"timestamp": "2025-01-15T16:00:00.000Z",
"data": {
"company": "comp-uuid-1234",
"issue_id": "issue-uuid-5678",
"classification": "Cross-Site Scripting (XSS)",
"urgency": "ME",
"status": "open",
"assigned_to": {
"id": "user-uuid-1111",
"email": "jane.doe@company.com",
"name": "Jane Doe"
},
"previously_assigned_to": {
"id": "user-uuid-2222",
"email": "john.smith@company.com",
"name": "John Smith"
},
"project": {
"id": "proj-uuid-9012",
"name": "Production API"
},
"url": "https://app.corgea.com/issue/issue-uuid-5678/"
}
}
```
```json sla-violation.json theme={null}
{
"event_id": "f6a7b8c9-d0e1-2345-f012-345678901234",
"event_type": "sla.violation",
"timestamp": "2025-01-15T16:20:00.000Z",
"data": {
"company": "comp-uuid-1234",
"sla": {
"id": 3,
"rule_type": "sca",
"urgency": ["CR", "HI"],
"remediation_days": 14,
"escalation_days": 7
},
"notification_type": "escalation",
"issue_kind": "SCA",
"issue_count": 12,
"summary_message": "Plain-text summary of breached issues...",
"projects": [
{
"id": "proj-uuid-9012",
"name": "Production API",
"url": "https://app.corgea.com/project/proj-uuid-9012",
"issue_count": 12,
"urgency_counts": {
"Critical": 4,
"High": 8
}
}
]
}
}
```
```json user-login.json theme={null}
{
"event_id": "d4e5f6a7-b8c9-0123-def0-123456789012",
"event_type": "user.login",
"timestamp": "2025-01-15T16:10:00.000Z",
"data": {
"company": "comp-uuid-1234",
"user_id": 123,
"username": "jane.doe",
"email": "jane.doe@company.com",
"first_name": "Jane",
"last_name": "Doe",
"user_agent": "Mozilla/5.0",
"path": "/login/"
}
}
```
```json user-login-failed.json theme={null}
{
"event_id": "e5f6a7b8-c9d0-1234-ef01-234567890123",
"event_type": "user.login_failed",
"timestamp": "2025-01-15T16:12:00.000Z",
"data": {
"company": "comp-uuid-1234",
"username": "jane.doe",
"user_agent": "Mozilla/5.0",
"path": "/login/"
}
}
```
```json scheduled-scan-daily-report.json theme={null}
{
"event_id": "3282dbbb-7392-476b-8ce2-19fc1070342c",
"event_type": "scheduled_scan.daily_report",
"timestamp": "2026-05-13T12:29:53.083616+00:00",
"data": {
"title": "🐕 Corgea Daily Scan Report",
"company": "123",
"company_name": "Acme Corp",
"total_new_issues": 7,
"message": "Daily scan report for Acme Corp: 7 new issues detected across 2 scan runs.",
"scan_runs": [
{
"scheduled_scan_name": "Nightly API Scan",
"project": "api-service",
"new_issue_count": 5,
"scan_url": "https://app.corgea.com/scans/abc123"
},
{
"scheduled_scan_name": "Nightly Frontend Scan",
"project": "frontend",
"new_issue_count": 2,
"scan_url": "https://app.corgea.com/scans/def456"
}
]
}
}
```
The outer envelope (`event_id`, `event_type`, `timestamp`, `data`) follows the [standard payload structure](#payload-structure). The `data` object contains:
| Field | Type | Description |
| --------------------------------- | -------------- | ------------------------------------------------------------------------- |
| `title` | string | Display title for the report |
| `company` | string | Company ID |
| `company_name` | string | Display name of the company |
| `total_new_issues` | integer | Sum of new issues across all scan runs in the payload |
| `message` | string | Human-readable summary suitable for plain-text notifications (e.g. Slack) |
| `scan_runs` | array | One entry per scan run that produced at least one new finding |
| `scan_runs[].scheduled_scan_name` | string | Name of the scheduled scan configuration |
| `scan_runs[].project` | string \| null | Project name, or `null` if no project is linked |
| `scan_runs[].new_issue_count` | integer | Number of new issues found in this run |
| `scan_runs[].scan_url` | string \| null | Deep link to the scan results in Corgea, or `null` if unavailable |
***
## FAQ
Yes! Your endpoint will receive an `X-Corgea-Event` header and `event_type` field to identify the event.
There's no hard limit, but we recommend organizing by purpose (e.g., one per team or tool).
Corgea will retry 3 times with exponential backoff. After 10 consecutive failures, the webhook auto-pauses.
Yes! Use the "Test Webhook" button to send a sample payload without waiting for real events. For Slack Workflow Builder, the sample is flat and includes a non-empty `message` plus triage keys (`pull_request_id`, `scan_url`, `true_positive_count`, `company`). `company_id` is also included (same value) for older Test consumers.
Yes. Under **Scan Event Filters**, enable **Only pull request / merge request scans** and **Only completed scans with true-positive findings**. Subscribe to `scan.failed` and `scan.completed`. The findings filter does not apply to `scan.failed`.
Yes! Corgea auto-generates a secret key for HMAC signature verification (`X-Corgea-Signature`). You can also add custom headers for destination-specific auth tokens.
Not directly, but you can filter by project. You can also filter on the received payload in your endpoint.
Payloads are sent over HTTPS (TLS), providing encryption in transit. Use HMAC signatures for verification.
Delivery logs are retained for compliance and debugging. Check with your plan for specific retention periods.
Yes! Go to the webhook delivery history and click "Retry" on any failed delivery.
Contact support for the current list of IP addresses to whitelist in your firewall.
***
**Questions or issues?** Contact [Corgea Support](mailto:support@corgea.com)